Colors and Color Maps
In COMPAS colors are defined in RGB color space, with components in the range of 0-1.
Basic Usage
Color Spaces
Color Information
The RGB Color Circle
The color class (compas.colors.Color) provides constructor methods
for the primary, secondary, and tertiary colors of the RGB color wheel or color circle.
Primary Colors
>>> Color.red()
Color(1.0, 0.0, 0.0, 1.0)
>>> Color.green()
Color(0.0, 1.0, 0.0, 1.0)
>>> Color.blue()
Color(0.0, 0.0, 1.0, 1.0)
Secondary Colors
>>> Color.yellow()
Color(1.0, 1.0, 0.0, 1.0)
>>> Color.cyan()
Color(0.0, 1.0, 1.0, 1.0)
>>> Color.magenta()
Color(1.0, 0.0, 1.0, 1.0)
Tertiary Colors
>>> Color.orange()
Color(1.0, 0.5, 0.0, 1.0)
>>> Color.lime()
Color(0.5, 1.0, 0.0, 1.0)
>>> Color.mint()
Color(0.0, 1.0, 0.5, 1.0)
>>> Color.azure()
Color(0.0, 0.5, 1.0, 1.0)
>>> Color.violet()
Color(0.5, 0.0, 1.0, 1.0)
>>> Color.pink()
Color(1.0, 0.0, 0.5, 1.0)
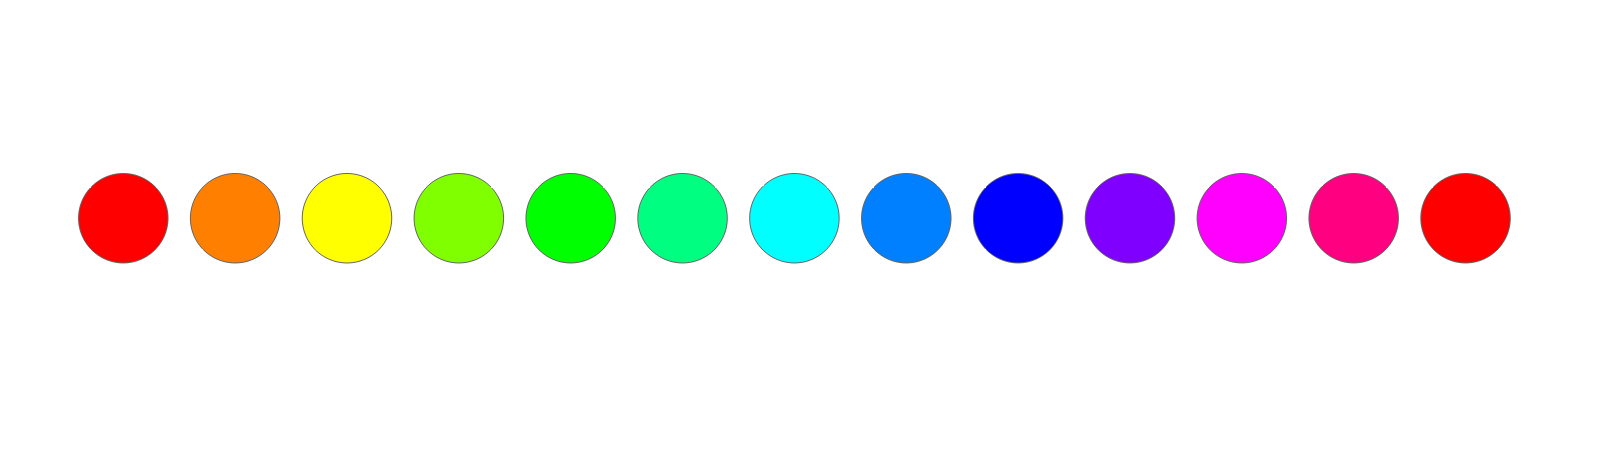
The RGB color circle.
Lighter and Darker Colors
The color class (compas.colors.Color) provides methods to generate lighter and darker variations of a given color.
The methods can be used to modify the colors in-place (compas.colors.Color.lighten() and compas.colors.Color.darken()),
or to generate new colors (compas.colors.Color.lightened() and compas.colors.Color.darkened()).
>>> red = Color.red()
>>> red.lighten(50)
None
>>> red.darken(50)
None
>>> red
Color(1.0, 0.0, 0.0, 1.0)
>>> red = Color.red()
>>> red.lightened(50)
Color(1.0, 0.5, 0.5, 1.0)
>>> red.darkened(50)
Color(0.5, 0.0, 0.0, 1.0)
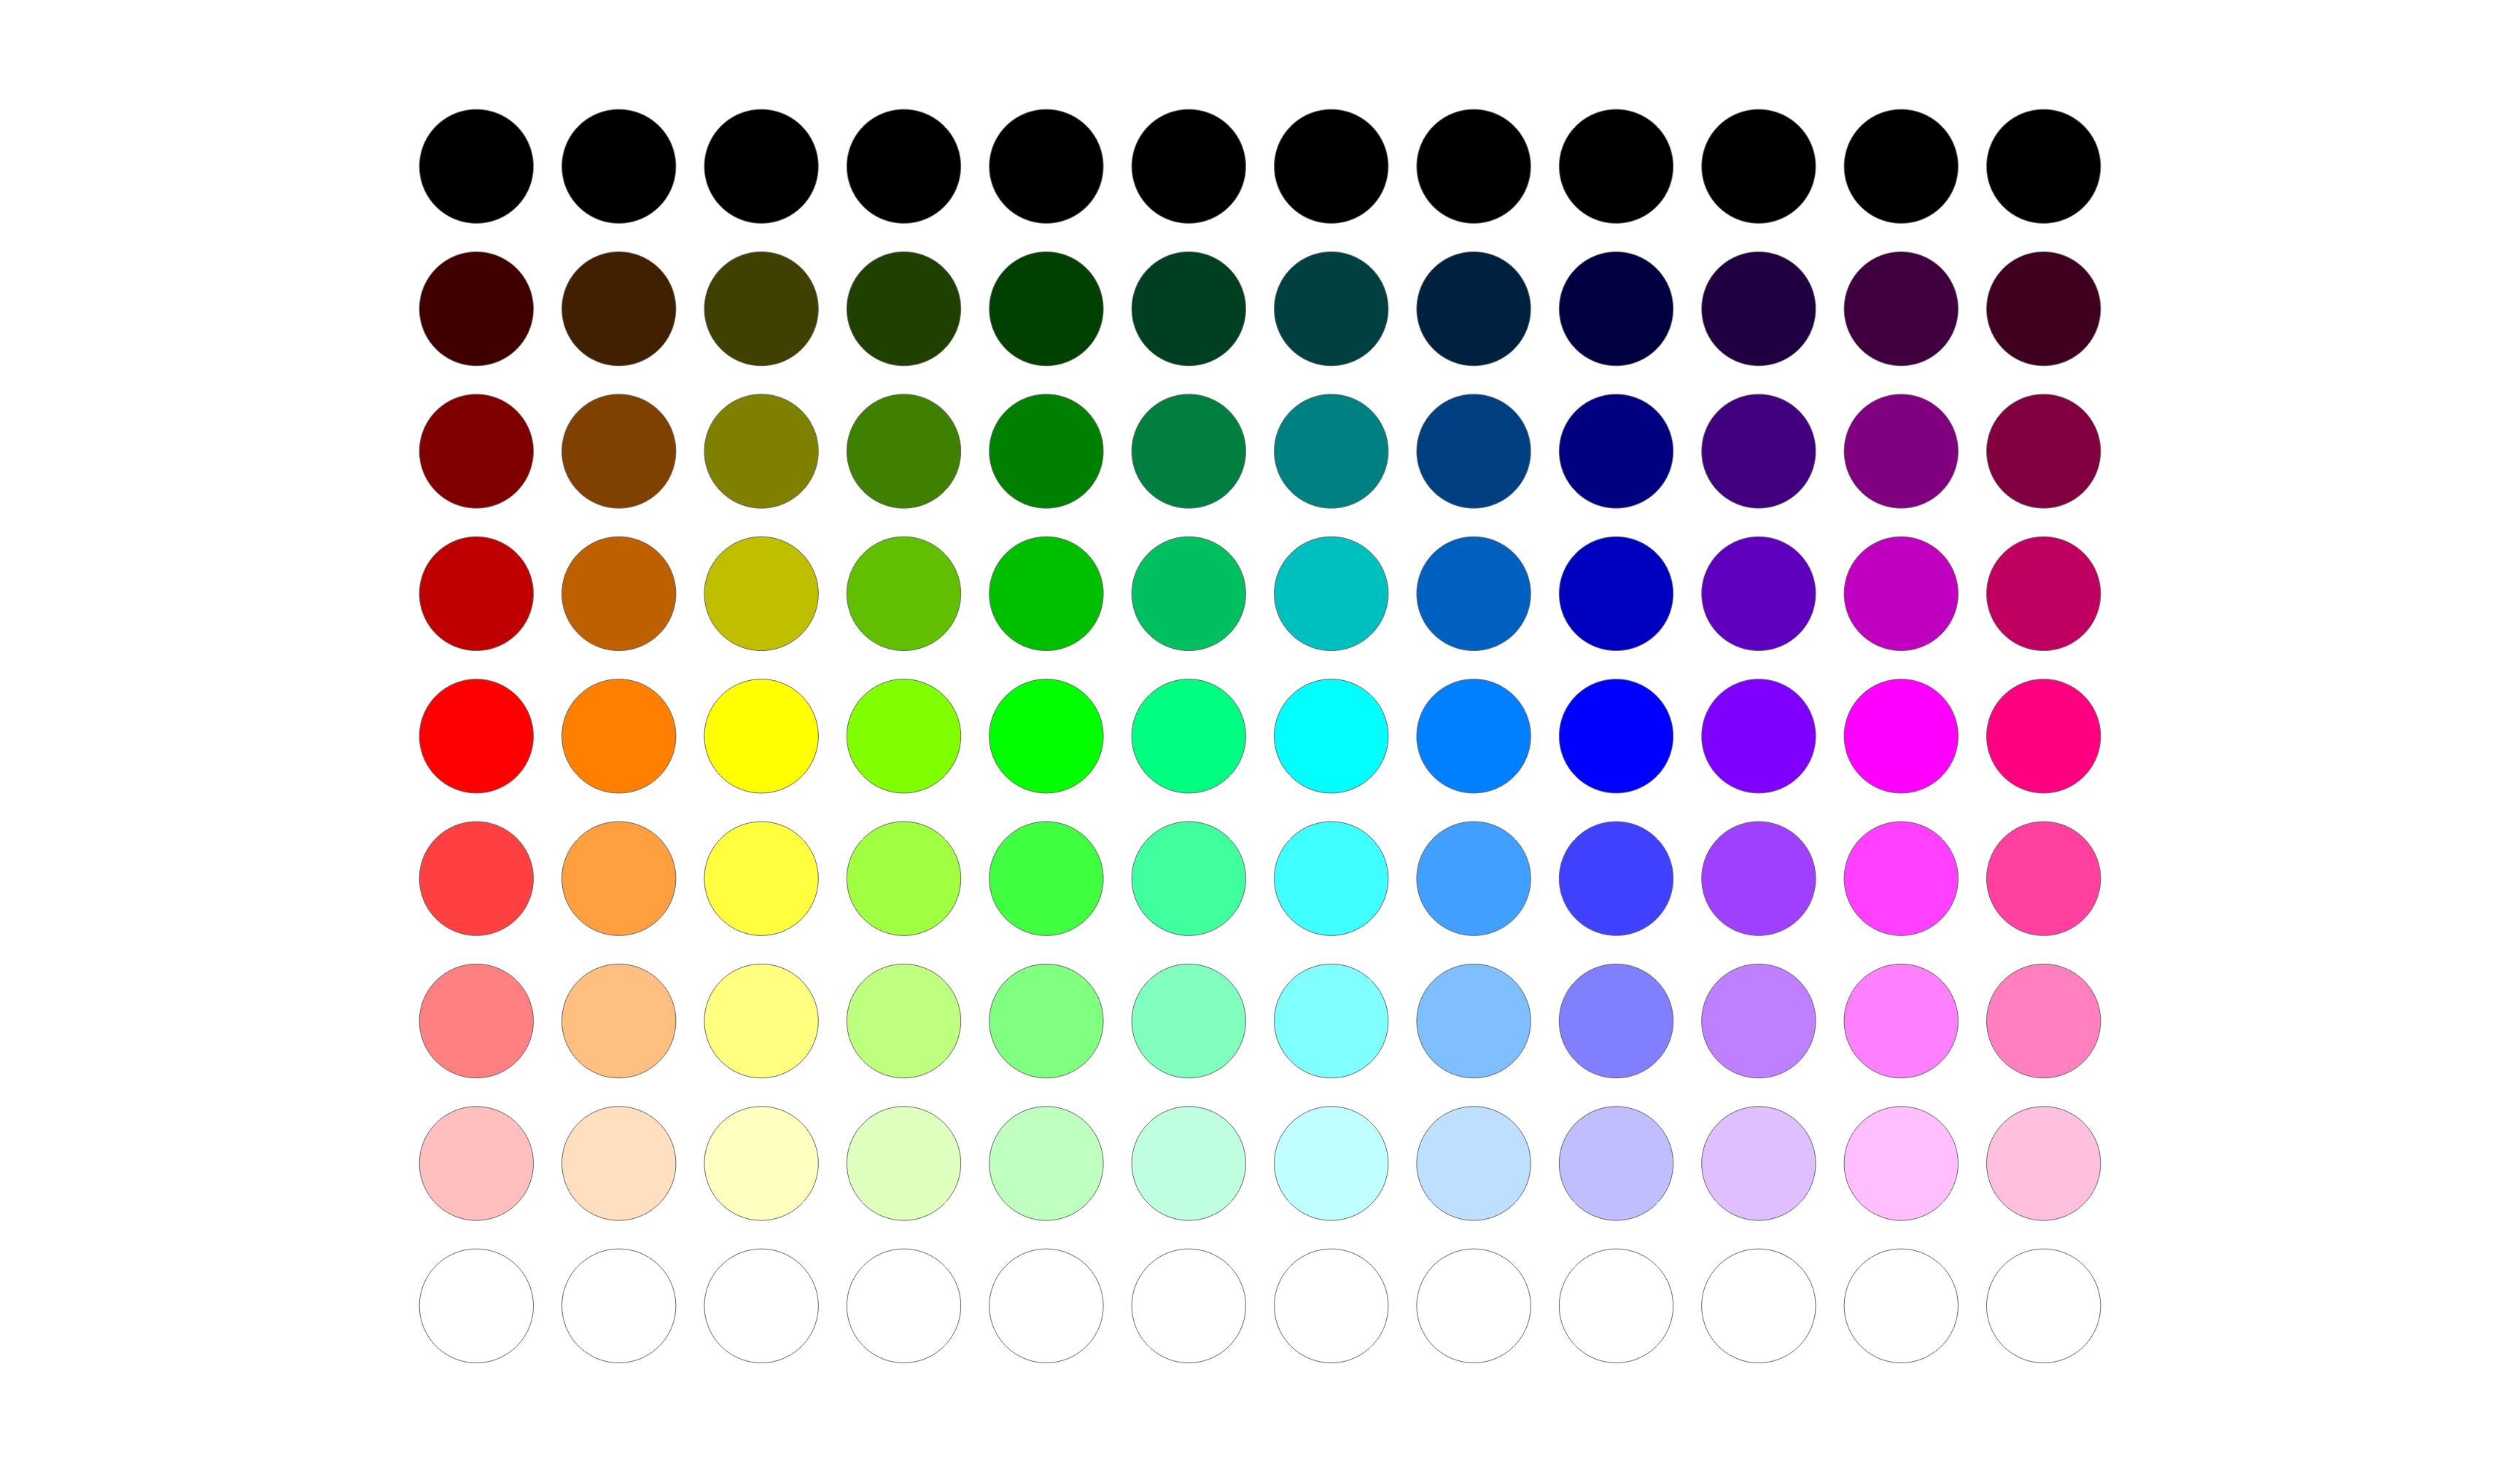
Lightness.
Saturation
Similar to generating lighter and darker colors, the color class provides methods for saturating or desaturating colors
(compas.colors.Color.saturate() and compas.colors.Color.desaturate(), and compas.colors.Color.saturated() and compas.colors.Color.desaturated()).
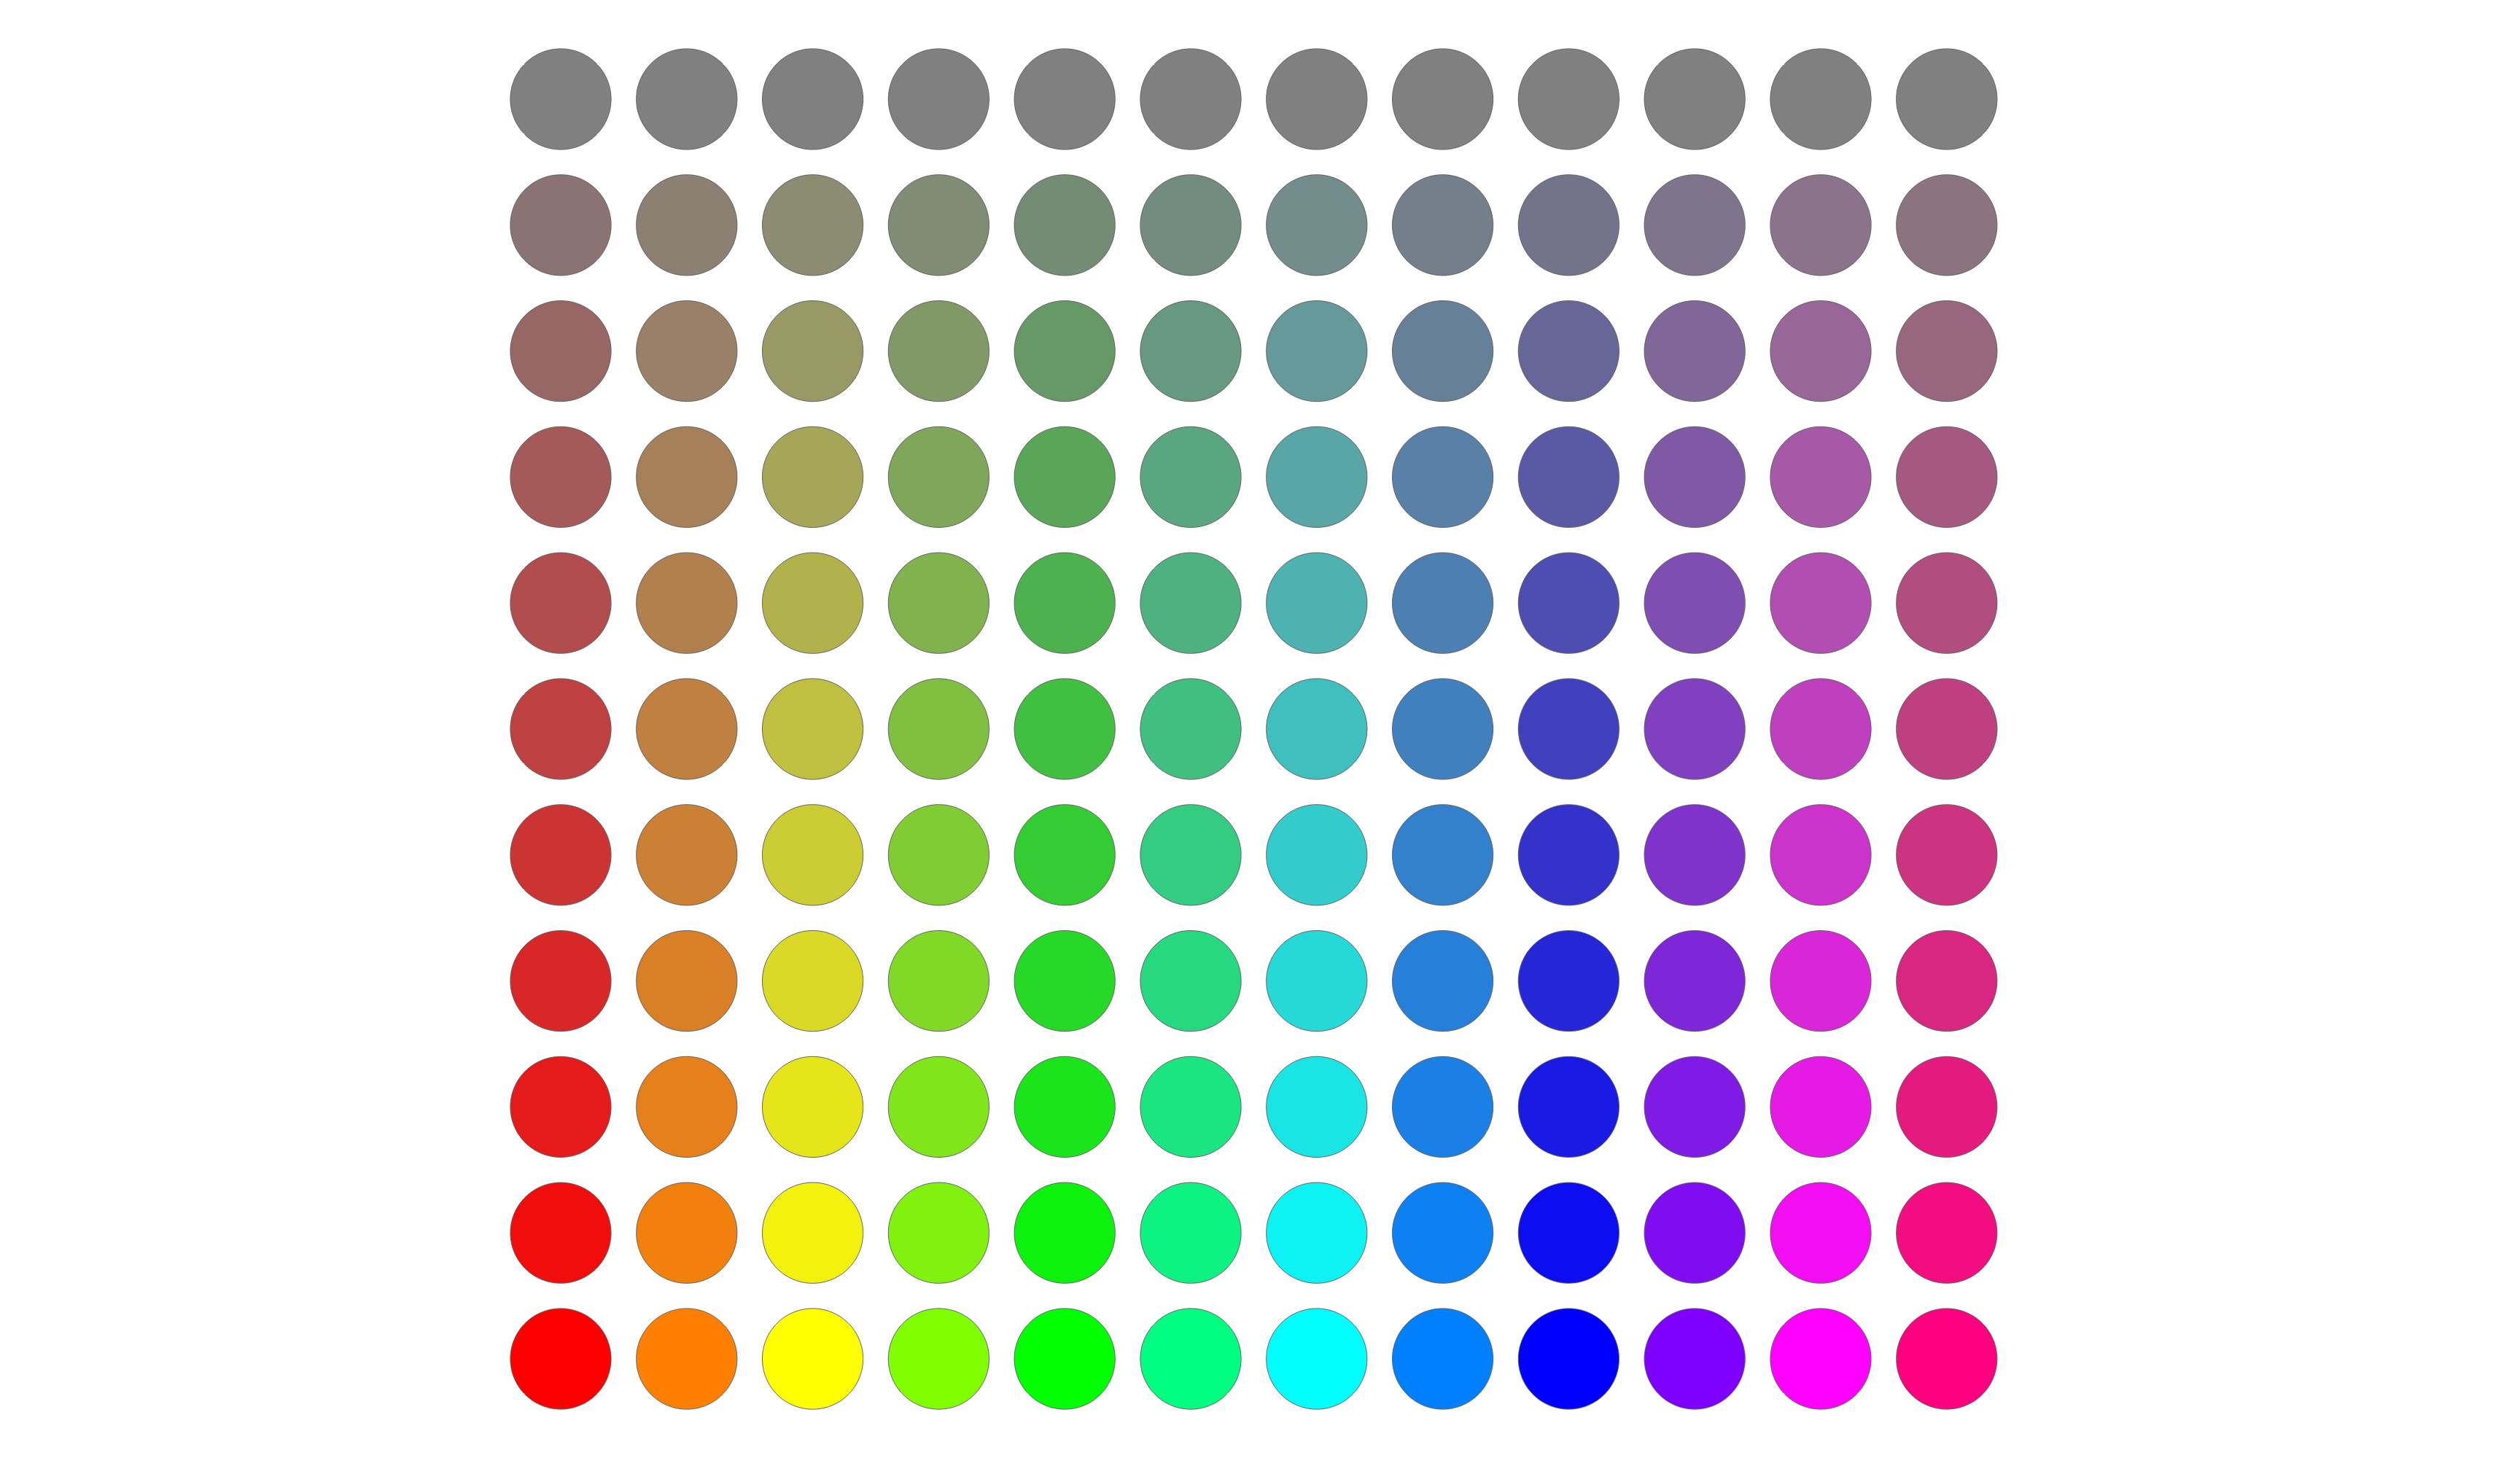
Saturation.
Color Maps
Using compas.colors.ColorMap, color maps can be constructed from various color inputs.
Maps based on named scientific color palettes designed by Fabio Crameri (https://www.fabiocrameri.ch/colourmaps/) and some of the matplotlib color palettes are also available.
There is currently no predefined function for color map examples. However, using the following template we can compare various examples.
>>> from compas.geometry import Point, Polygon
>>> from compas.utilities import linspace, pairwise
>>> from compas.datastructures import Mesh
>>> from compas.colors import Color, ColorMap
>>> from compas_viewer import Viewer
>>> n = 1000
>>> t = 0.3
>>> up = []
>>> down = []
>>> for i in linspace(0, 10, n):
...    point = Point(i, 0, 0)
...    up.append(point + [0, t, 0])
...    down.append(point - [0, t, 0])
>>> polygons = []
>>> for (d, c), (a, b) in zip(pairwise(up), pairwise(down)):
...    polygons.append(Polygon([a, b, c, d]))
>>> mesh = Mesh.from_polygons(polygons)
>>> cmap = ...  # define color map here
>>> facecolor = {i: cmap(i, minval=0, maxval=n - 1) for i in range(n)}
>>> viewer = Viewer(show_grid = False)
>>> viewer.scene.add(mesh, facecolor=facecolor, show_lines=False)
>>> viewer.show()
From Palette
>>> cmap = ColorMap.from_mpl('viridis')

viridis color map from matplotlib.
From RGB
>>> cmap = ColorMap.from_rgb()
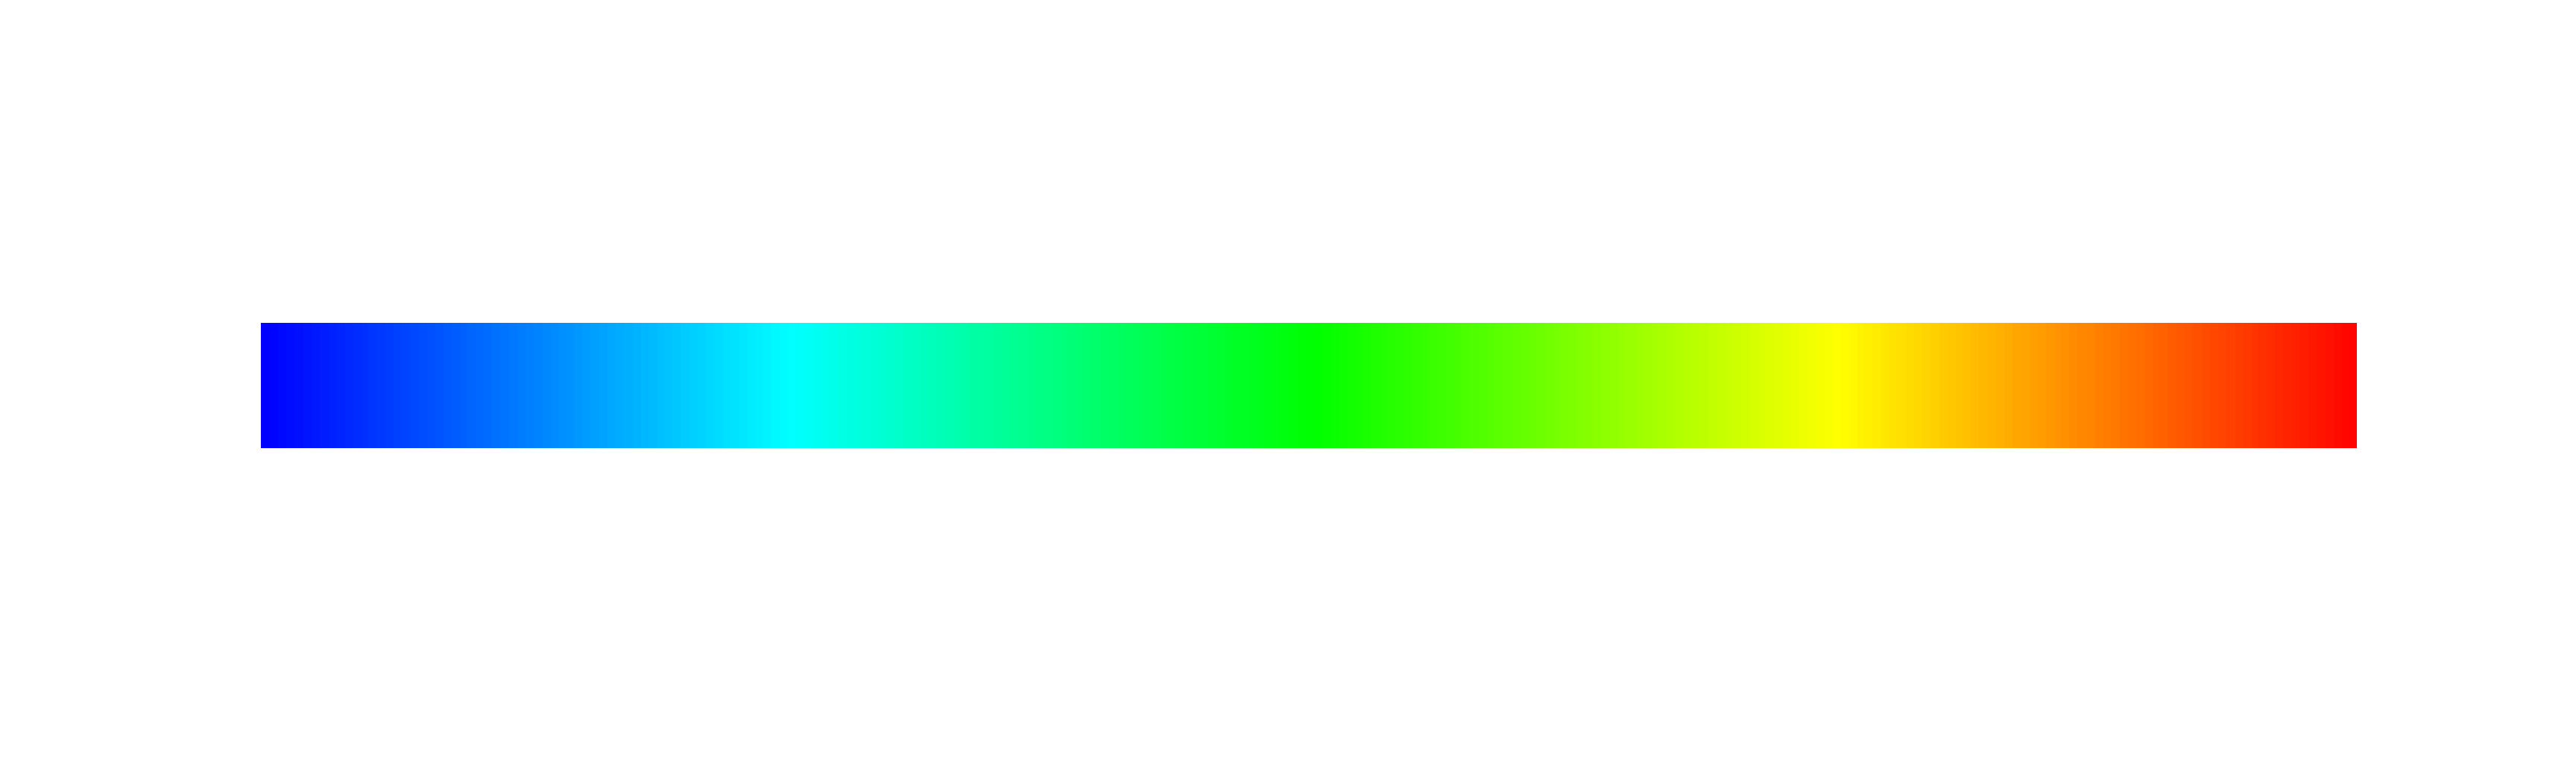
Color map from RGB.
From One Color
>>> cmap = ColorMap.from_color(Color.red())
>>> cmap = ColorMap.from_color(Color.red(), rangetype='light')
>>> cmap = ColorMap.from_color(Color.red(), rangetype='dark')

Color maps constructed from a single color.
From Two Colors
>>> cmap = ColorMap.from_two_colors(Color.from_hex('#0092D2'), Color.pink())
>>> cmap = ColorMap.from_two_colors(Color.from_hex('#0092D2'), Color.pink(), diverging=True)

Color maps constructed from two colors.
From Three Colors
>>> cmap = ColorMap.from_three_colors(Color.red(), Color.green(), Color.blue())

Color maps constructed from three colors.