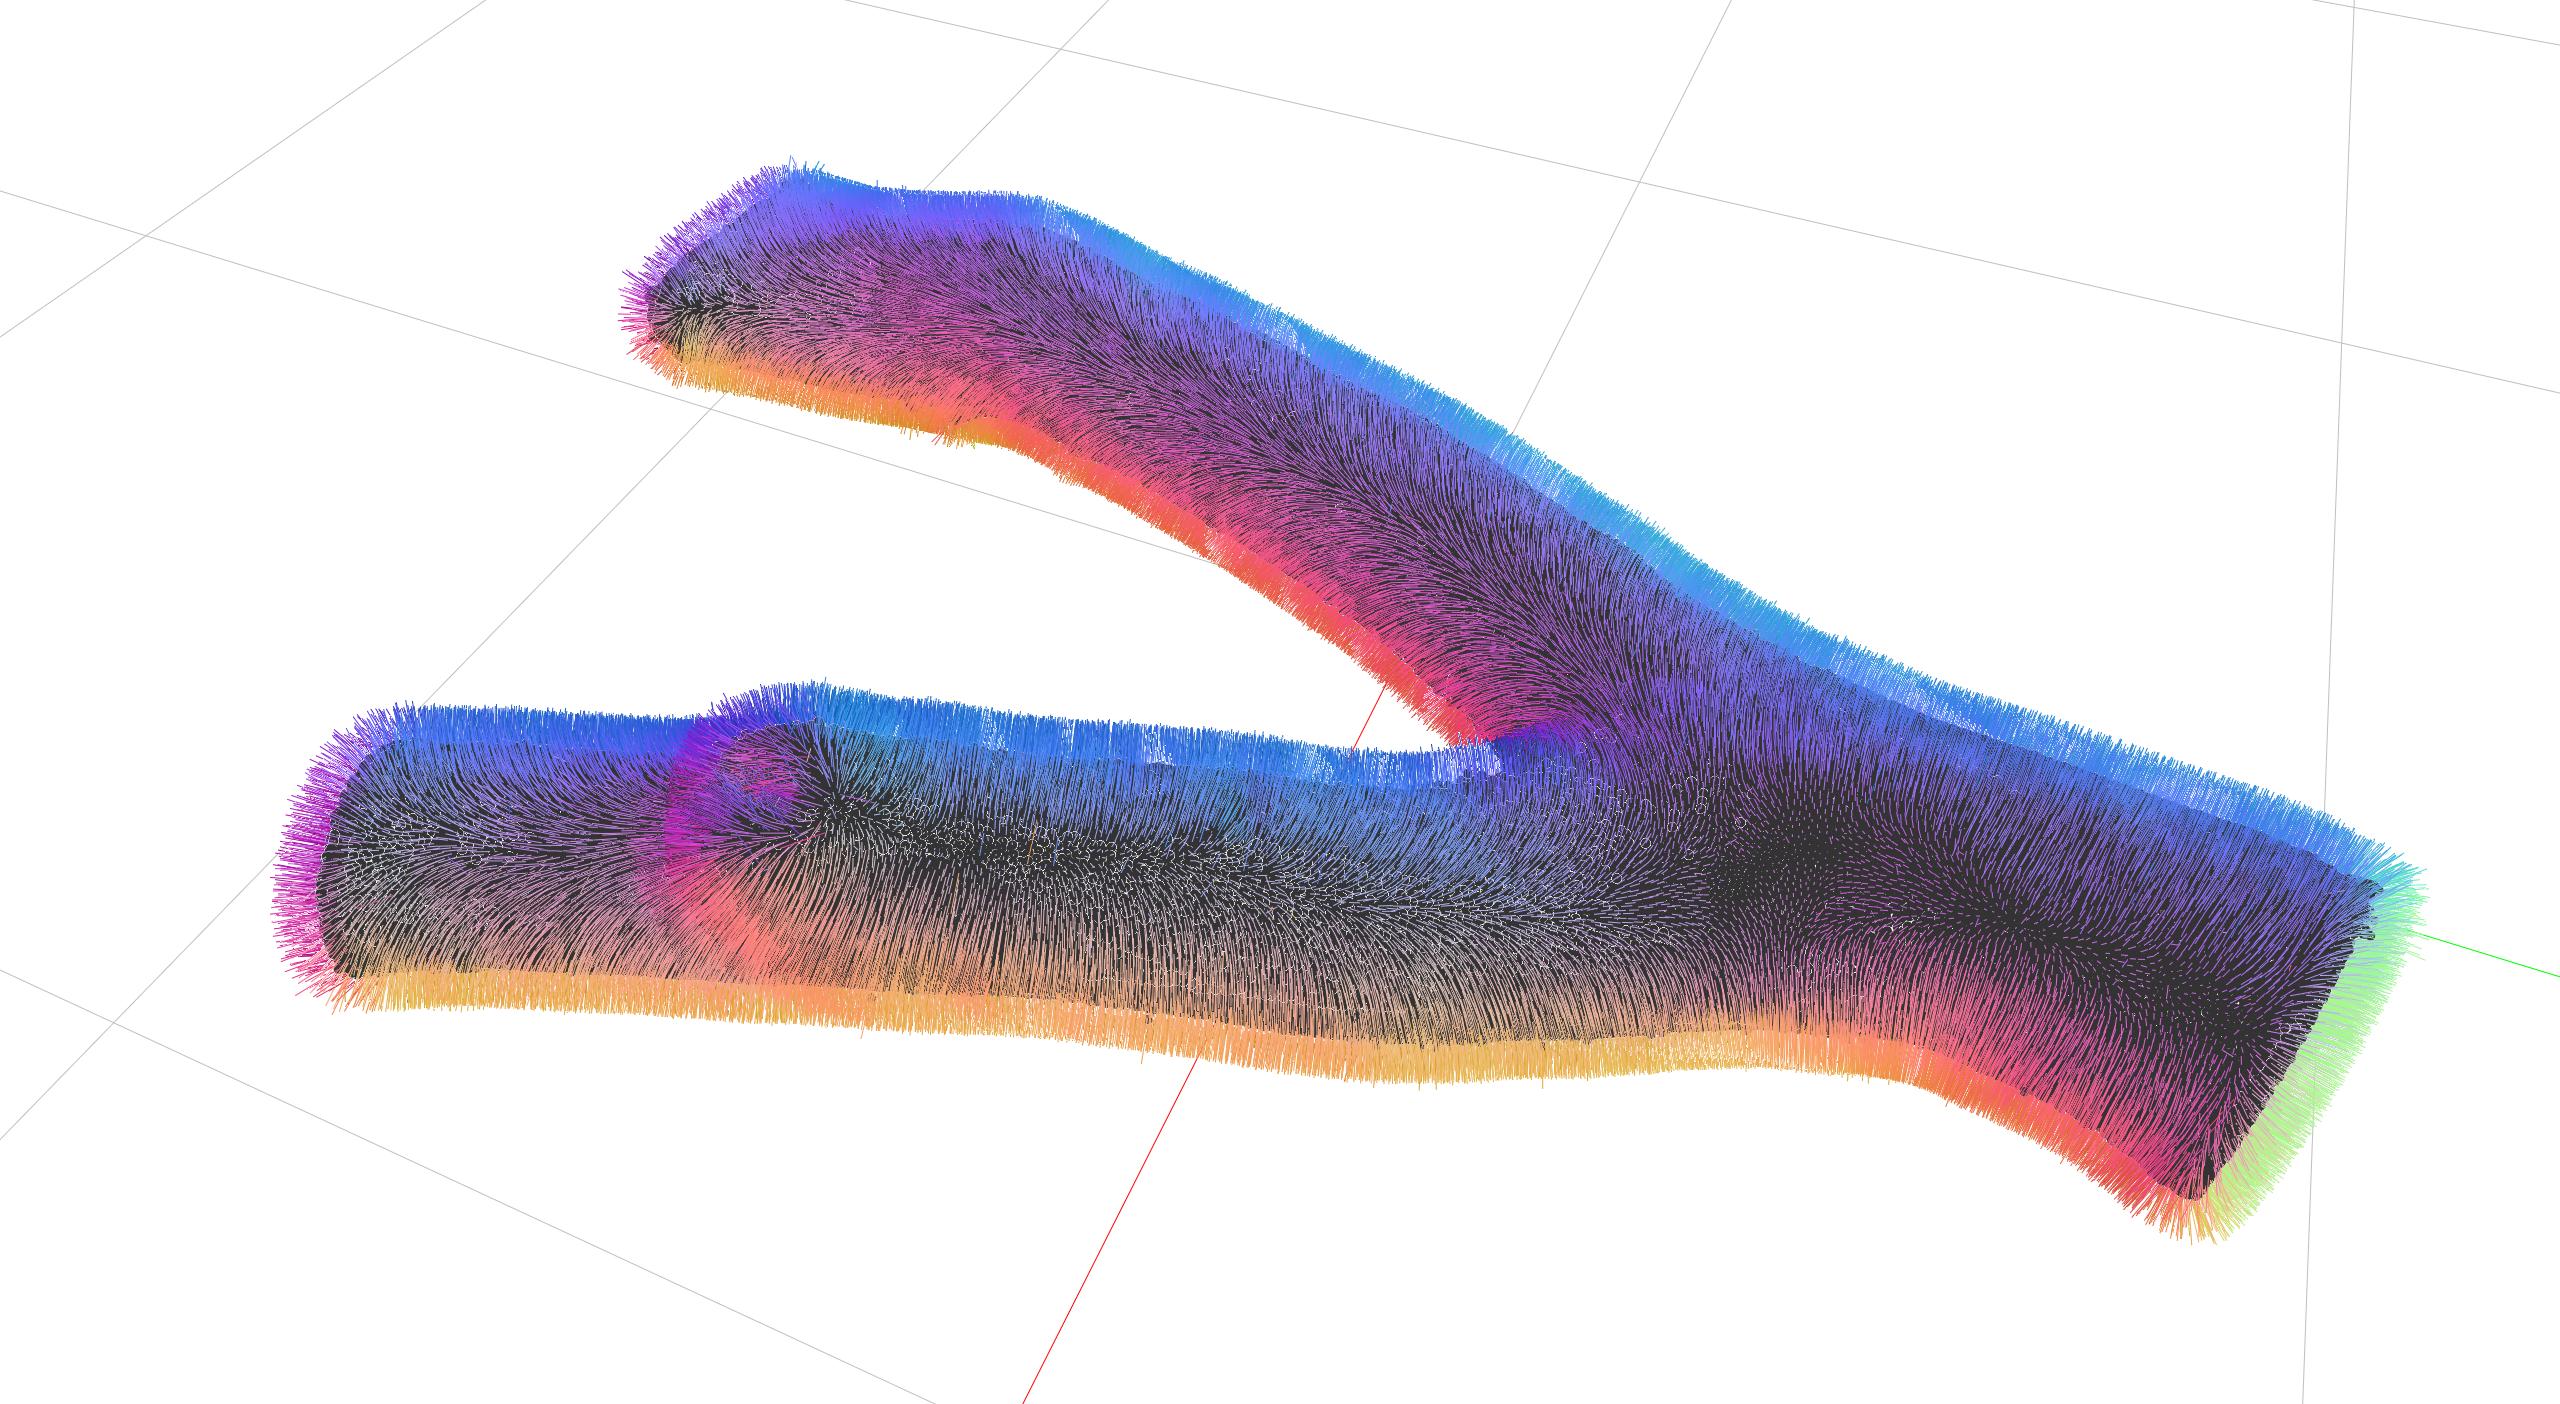
frompathlibimportPathfromcompas.geometryimportPointcloud,Point,Linefromcompas_view2.appimportAppfromcompas_view2.collectionsimportCollectionfromcompas.colorsimportColorfromcompas_cgal.reconstructionimportpointset_normal_estimation# Define the file path for the point cloud dataFILE=Path(__file__).parent.parent.parent/"data"/"forked_branch_1.ply"# Load the point cloud data from the PLY filecloud=Pointcloud.from_ply(FILE)# Estimate normals for the point cloudpoints,vectors=pointset_normal_estimation(cloud,16,True)print(f"Original points: {len(cloud)}, Points with normals: {len(points)}, Vectors: {len(vectors)}")# Create lines and properties for visualizing normalslines=[]line_properties=[]line_scale=25# Iterate over points and vectors to create lines and color propertiesforp,vinzip(points,vectors):lines.append(Line(Point(p[0],p[1],p[2]),Point(p[0]+v[0]*line_scale,p[1]+v[1]*line_scale,p[2]+v[2]*line_scale)))# Normalize vector components to be in the range [0, 1] for color representationr=(v[0]+1)*0.5g=(v[1]+1)*0.5b=(v[2]+1)*0.5# Store line color propertiesline_properties.append({'linecolor':Color(r,g,b)})# Initialize the COMPAS viewerviewer=App(width=1600,height=900)# Adjust viewer settingsviewer.view.camera.scale=1000viewer.view.grid.cell_size=1000# Create a line collection and add it to the viewerline_collection=Collection(lines,line_properties)viewer.add(Pointcloud(points))viewer.add(line_collection)# Set the camera to zoom to fit all points and linesviewer.view.camera.zoom_extents()# Run the viewerviewer.run()