2. Simple curved interpolation slicing
A general introduction of the concepts organization of compas_slicer can be found in the introduction tutorial.
Make sure to read the example on simple planar slicing before reading this example, as it explains the main concepts of compas_slicer. Having done that, in this example, we go through the basics of using the non-planar interpolation slicer, which generates paths by interpolating user-defined boundaries. This example uses the method described in Print Paths KeyFraming.
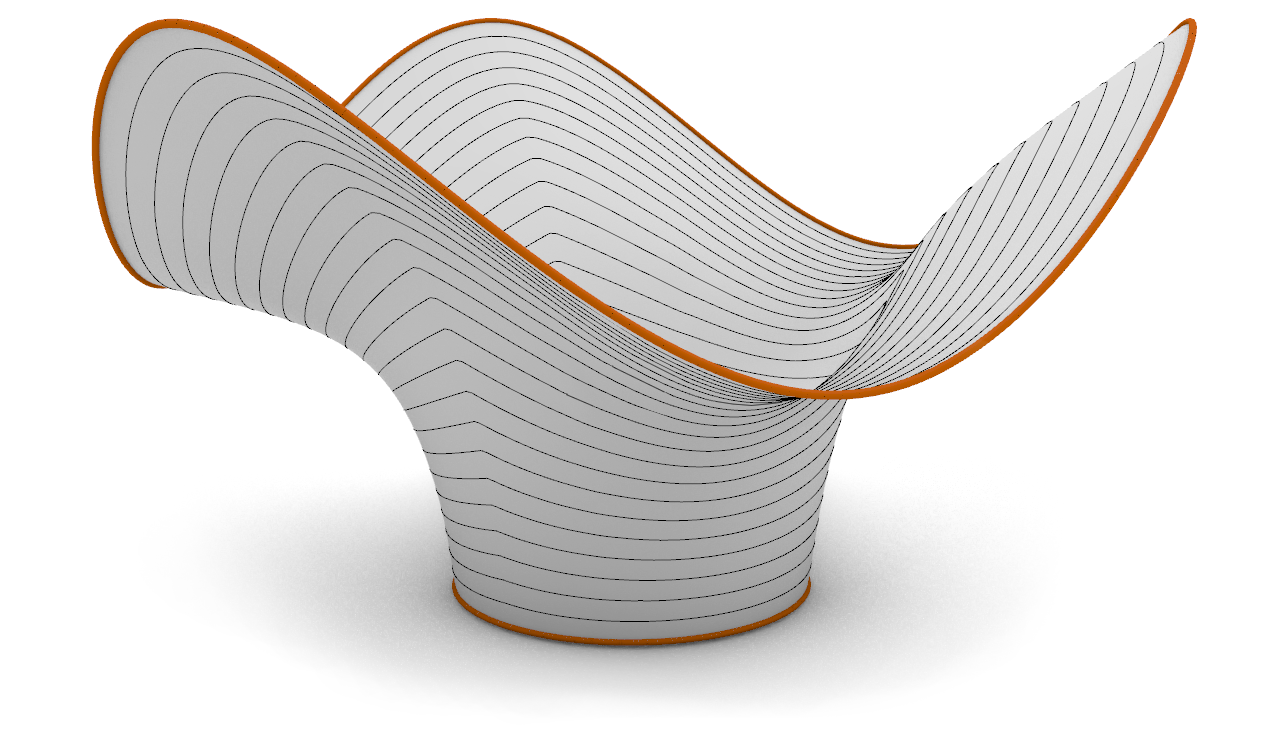
Result of simple curved slicing.
2.1. Imports and initialization
import os
from compas.datastructures import Mesh
import logging
import compas_slicer.utilities as utils
from compas_slicer.slicers import InterpolationSlicer
from compas_slicer.post_processing import simplify_paths_rdp_igl
from compas_slicer.pre_processing import InterpolationSlicingPreprocessor
from compas_slicer.print_organization import set_extruder_toggle, set_linear_velocity_by_range
from compas_slicer.print_organization import add_safety_printpoints
from compas_slicer.pre_processing import create_mesh_boundary_attributes
from compas_slicer.print_organization import InterpolationPrintOrganizer
from compas_slicer.post_processing import seams_smooth
from compas_slicer.print_organization import smooth_printpoints_up_vectors, smooth_printpoints_layer_heights
from compas_slicer.post_processing import generate_brim
from compas_view2 import app

logger = logging.getLogger('logger')
logging.basicConfig(format='%(levelname)s - %(message)s', level=logging.INFO)

DATA_PATH = os.path.join(os.path.dirname(__file__), 'data_basic_example')
OUTPUT_PATH = utils.get_output_directory(DATA_PATH)
OBJ_INPUT_NAME = os.path.join(DATA_PATH, 'vase.obj')
2.2. Slicing process
# --- Load initial_mesh
mesh = Mesh.from_obj(os.path.join(DATA_PATH, OBJ_INPUT_NAME))
The interpolation slicer works by interpolating boundaries provided by the user. Each boundary is represented by a list of vertex indices, that have been saved in the json files.
# --- Load targets (boundaries)
low_boundary_vs = utils.load_from_json(DATA_PATH, 'boundaryLOW.json')
high_boundary_vs = utils.load_from_json(DATA_PATH, 'boundaryHIGH.json')
create_mesh_boundary_attributes(mesh, low_boundary_vs, high_boundary_vs)
The slicing process has a number of configuration parameters. Defaults have been specified for all of those parameters.
To see the parameters and their default values, look at parameters/defaults_interpolation_slicing.py. To override
parameters, you can create a parameters dictionary with all the parameters that you want to override. The ‘avg_layer_height’
determines how dense the layers will be generated on the surface.
avg_layer_height = 15.0
parameters = {
    'avg_layer_height': avg_layer_height,  # controls number of curves that will be generated
    'min_layer_height': 0.3,
    'max_layer_height': 5.0  # 2.0,
}
The InterpolationSlicingPreprocessor sets up all the data that are necessary for the interpolation process.
preprocessor = InterpolationSlicingPreprocessor(mesh, parameters, DATA_PATH)
preprocessor.create_compound_targets()
g_eval = preprocessor.create_gradient_evaluation(norm_filename='gradient_norm.json', g_filename='gradient.json',
                                                 target_1=preprocessor.target_LOW,
                                                 target_2=preprocessor.target_HIGH)
preprocessor.find_critical_points(g_eval, output_filenames=['minima.json', 'maxima.json', 'saddles.json'])
To slice the model by interpolating the boundaries, you can use the InterpolationSlicer class. The same post-processing
options are available for all slicers.
# --- slicing
slicer = InterpolationSlicer(mesh, preprocessor, parameters)
slicer.slice_model()  # compute_norm_of_gradient contours

# post processing
generate_brim(slicer, layer_width=3.0, number_of_brim_offsets=5)
seams_smooth(slicer, smooth_distance=10)
simplify_paths_rdp_igl(slicer, threshold=1.0)
slicer.printout_info()
utils.save_to_json(slicer.to_data(), OUTPUT_PATH, 'curved_slicer.json')
2.3. Print organization
The PrintOrganizer classes generate a list of compas_slicer.Printpoint instances that have the information
that is necessary for the print process.
# --- Print organizer
print_organizer = InterpolationPrintOrganizer(slicer, parameters, DATA_PATH)
print_organizer.create_printpoints()

set_linear_velocity_by_range(print_organizer, param_func=lambda ppt: ppt.layer_height,
                             parameter_range=[avg_layer_height*0.5, avg_layer_height*2.0],
                             velocity_range=[150, 70], bound_remapping=False)
set_extruder_toggle(print_organizer, slicer)
add_safety_printpoints(print_organizer, z_hop=10.0)
smooth_printpoints_up_vectors(print_organizer, strength=0.5, iterations=10)
smooth_printpoints_layer_heights(print_organizer, strength=0.5, iterations=5)
Output json file with printpoints.
# --- Save printpoints dictionary to json file
printpoints_data = print_organizer.output_printpoints_dict()
utils.save_to_json(printpoints_data, OUTPUT_PATH, 'out_printpoints.json')
Visualize the result using compas_viewer2
# ----- Visualize
viewer = app.App(width=1600, height=1000)
# slicer.visualize_on_viewer(viewer, visualize_mesh=False, visualize_paths=True)
print_organizer.visualize_on_viewer(viewer, visualize_printpoints=True)
viewer.show()
Once the slicing process is finished, you can use the compas_slicer grasshopper components to visualize the results, described in the grasshopper tutorial.
2.4. Final script
The completed final script can be found below:
import os
from compas.datastructures import Mesh
import logging
import compas_slicer.utilities as utils
from compas_slicer.slicers import InterpolationSlicer
from compas_slicer.post_processing import simplify_paths_rdp_igl
from compas_slicer.pre_processing import InterpolationSlicingPreprocessor
from compas_slicer.print_organization import set_extruder_toggle, set_linear_velocity_by_range
from compas_slicer.print_organization import add_safety_printpoints
from compas_slicer.pre_processing import create_mesh_boundary_attributes
from compas_slicer.print_organization import InterpolationPrintOrganizer
from compas_slicer.post_processing import seams_smooth
from compas_slicer.print_organization import smooth_printpoints_up_vectors, smooth_printpoints_layer_heights
from compas_slicer.post_processing import generate_brim
from compas_view2 import app
import time

logger = logging.getLogger('logger')
logging.basicConfig(format='%(levelname)s - %(message)s', level=logging.INFO)

DATA_PATH = os.path.join(os.path.dirname(__file__), 'data_basic_example')
OUTPUT_PATH = utils.get_output_directory(DATA_PATH)
OBJ_INPUT_NAME = os.path.join(DATA_PATH, 'vase.obj')


start_time = time.time()

# --- Load initial_mesh
mesh = Mesh.from_obj(os.path.join(DATA_PATH, OBJ_INPUT_NAME))

# --- Load targets (boundaries)
low_boundary_vs = utils.load_from_json(DATA_PATH, 'boundaryLOW.json')
high_boundary_vs = utils.load_from_json(DATA_PATH, 'boundaryHIGH.json')
create_mesh_boundary_attributes(mesh, low_boundary_vs, high_boundary_vs)

avg_layer_height = 15.0

parameters = {
    'avg_layer_height': avg_layer_height,  # controls number of curves that will be generated
    'min_layer_height': 0.3,
    'max_layer_height': 5.0  # 2.0,
}

preprocessor = InterpolationSlicingPreprocessor(mesh, parameters, DATA_PATH)
preprocessor.create_compound_targets()
g_eval = preprocessor.create_gradient_evaluation(norm_filename='gradient_norm.json', g_filename='gradient.json',
                                                 target_1=preprocessor.target_LOW,
                                                 target_2=preprocessor.target_HIGH)
preprocessor.find_critical_points(g_eval, output_filenames=['minima.json', 'maxima.json', 'saddles.json'])

# --- slicing
slicer = InterpolationSlicer(mesh, preprocessor, parameters)
slicer.slice_model()  # compute_norm_of_gradient contours
generate_brim(slicer, layer_width=3.0, number_of_brim_offsets=5)
seams_smooth(slicer, smooth_distance=10)

simplify_paths_rdp_igl(slicer, threshold=0.5)
slicer.printout_info()
utils.save_to_json(slicer.to_data(), OUTPUT_PATH, 'curved_slicer.json')

# --- Print organizer
print_organizer = InterpolationPrintOrganizer(slicer, parameters, DATA_PATH)
print_organizer.create_printpoints()

set_linear_velocity_by_range(print_organizer, param_func=lambda ppt: ppt.layer_height,
                             parameter_range=[avg_layer_height*0.5, avg_layer_height*2.0],
                             velocity_range=[150, 70], bound_remapping=False)
set_extruder_toggle(print_organizer, slicer)
add_safety_printpoints(print_organizer, z_hop=10.0)
smooth_printpoints_up_vectors(print_organizer, strength=0.5, iterations=10)
smooth_printpoints_layer_heights(print_organizer, strength=0.5, iterations=5)

# --- Save printpoints dictionary to json file
printpoints_data = print_organizer.output_printpoints_dict()
utils.save_to_json(printpoints_data, OUTPUT_PATH, 'out_printpoints.json')

# ----- Visualize
viewer = app.App(width=1600, height=1000)
# slicer.visualize_on_viewer(viewer, visualize_mesh=False, visualize_paths=True)
print_organizer.visualize_on_viewer(viewer, visualize_printpoints=True)
viewer.show()

end_time = time.time()
print("Total elapsed time", round(end_time - start_time, 2), "seconds")