from compas.geometry import Point
from compas.geometry import Box
from compas.geometry import Sphere
from compas.geometry import Polyline
from compas.datastructures import Mesh
from compas_view2.app import App
from compas_cgal.intersections import intersection_mesh_mesh
from compas_cgal.meshing import remesh
# ==============================================================================
# Make a box and a sphere
# ==============================================================================
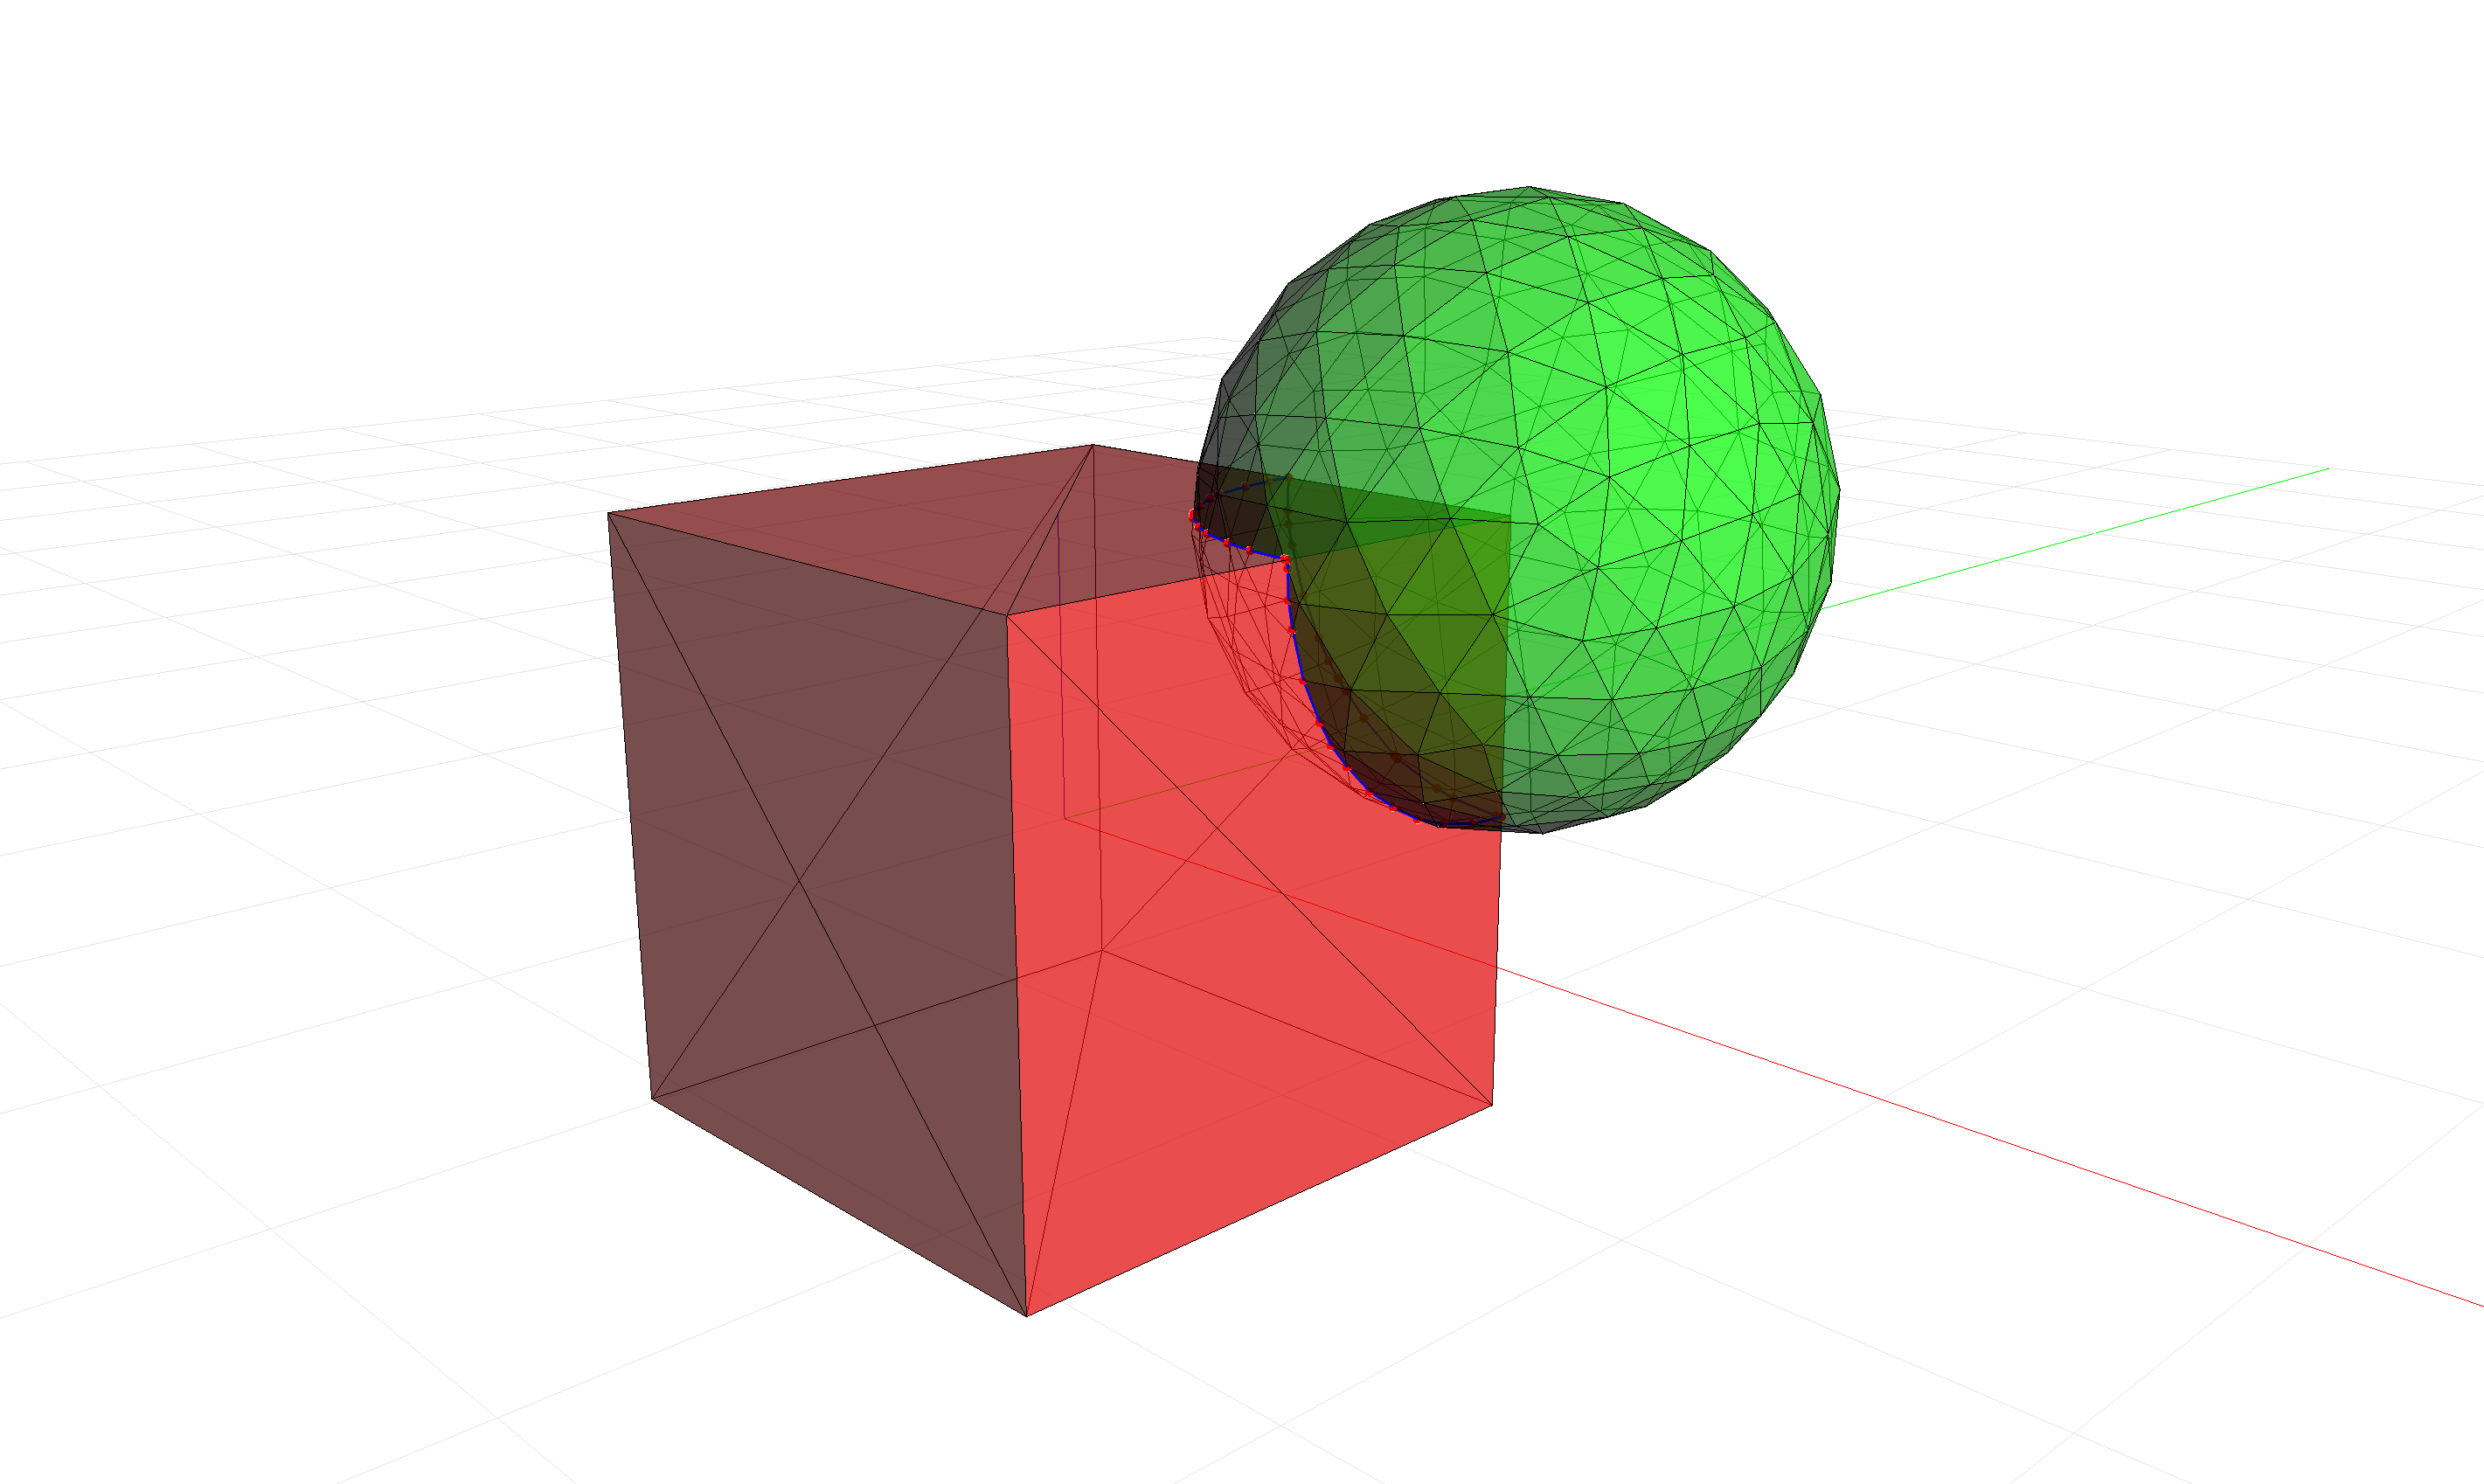
box = Box.from_width_height_depth(2, 2, 2)
box = Mesh.from_shape(box)
box.quads_to_triangles()
A = box.to_vertices_and_faces()
sphere = Sphere(Point(1, 1, 1), 1)
sphere = Mesh.from_shape(sphere, u=30, v=30)
sphere.quads_to_triangles()
B = sphere.to_vertices_and_faces()
# ==============================================================================
# Remesh the sphere
# ==============================================================================
B = remesh(B, 0.3, 10)
# ==============================================================================
# Compute the intersections
# ==============================================================================
pointsets = intersection_mesh_mesh(A, B)
# ==============================================================================
# Process output
# ==============================================================================
polylines = []
for points in pointsets:
points = [Point(*point) for point in points]
polyline = Polyline(points)
polylines.append(polyline)
# ==============================================================================
# Visualize
# ==============================================================================
viewer = App()
viewer.add(Mesh.from_vertices_and_faces(*A), facecolor=(1, 0, 0), opacity=0.7)
viewer.add(Mesh.from_vertices_and_faces(*B), facecolor=(0, 1, 0), opacity=0.7)
for polyline in polylines:
viewer.add(
polyline,
linecolor=(0, 0, 1),
linewidth=3,
pointcolor=(1, 0, 0),
pointsize=10,
show_points=True
)
viewer.run()