# type: ignore
from compas.geometry import Point
from compas.geometry import Polyline, Bezier
from compas_occ.geometry import OCCNurbsCurve
from compas_view2.app import App
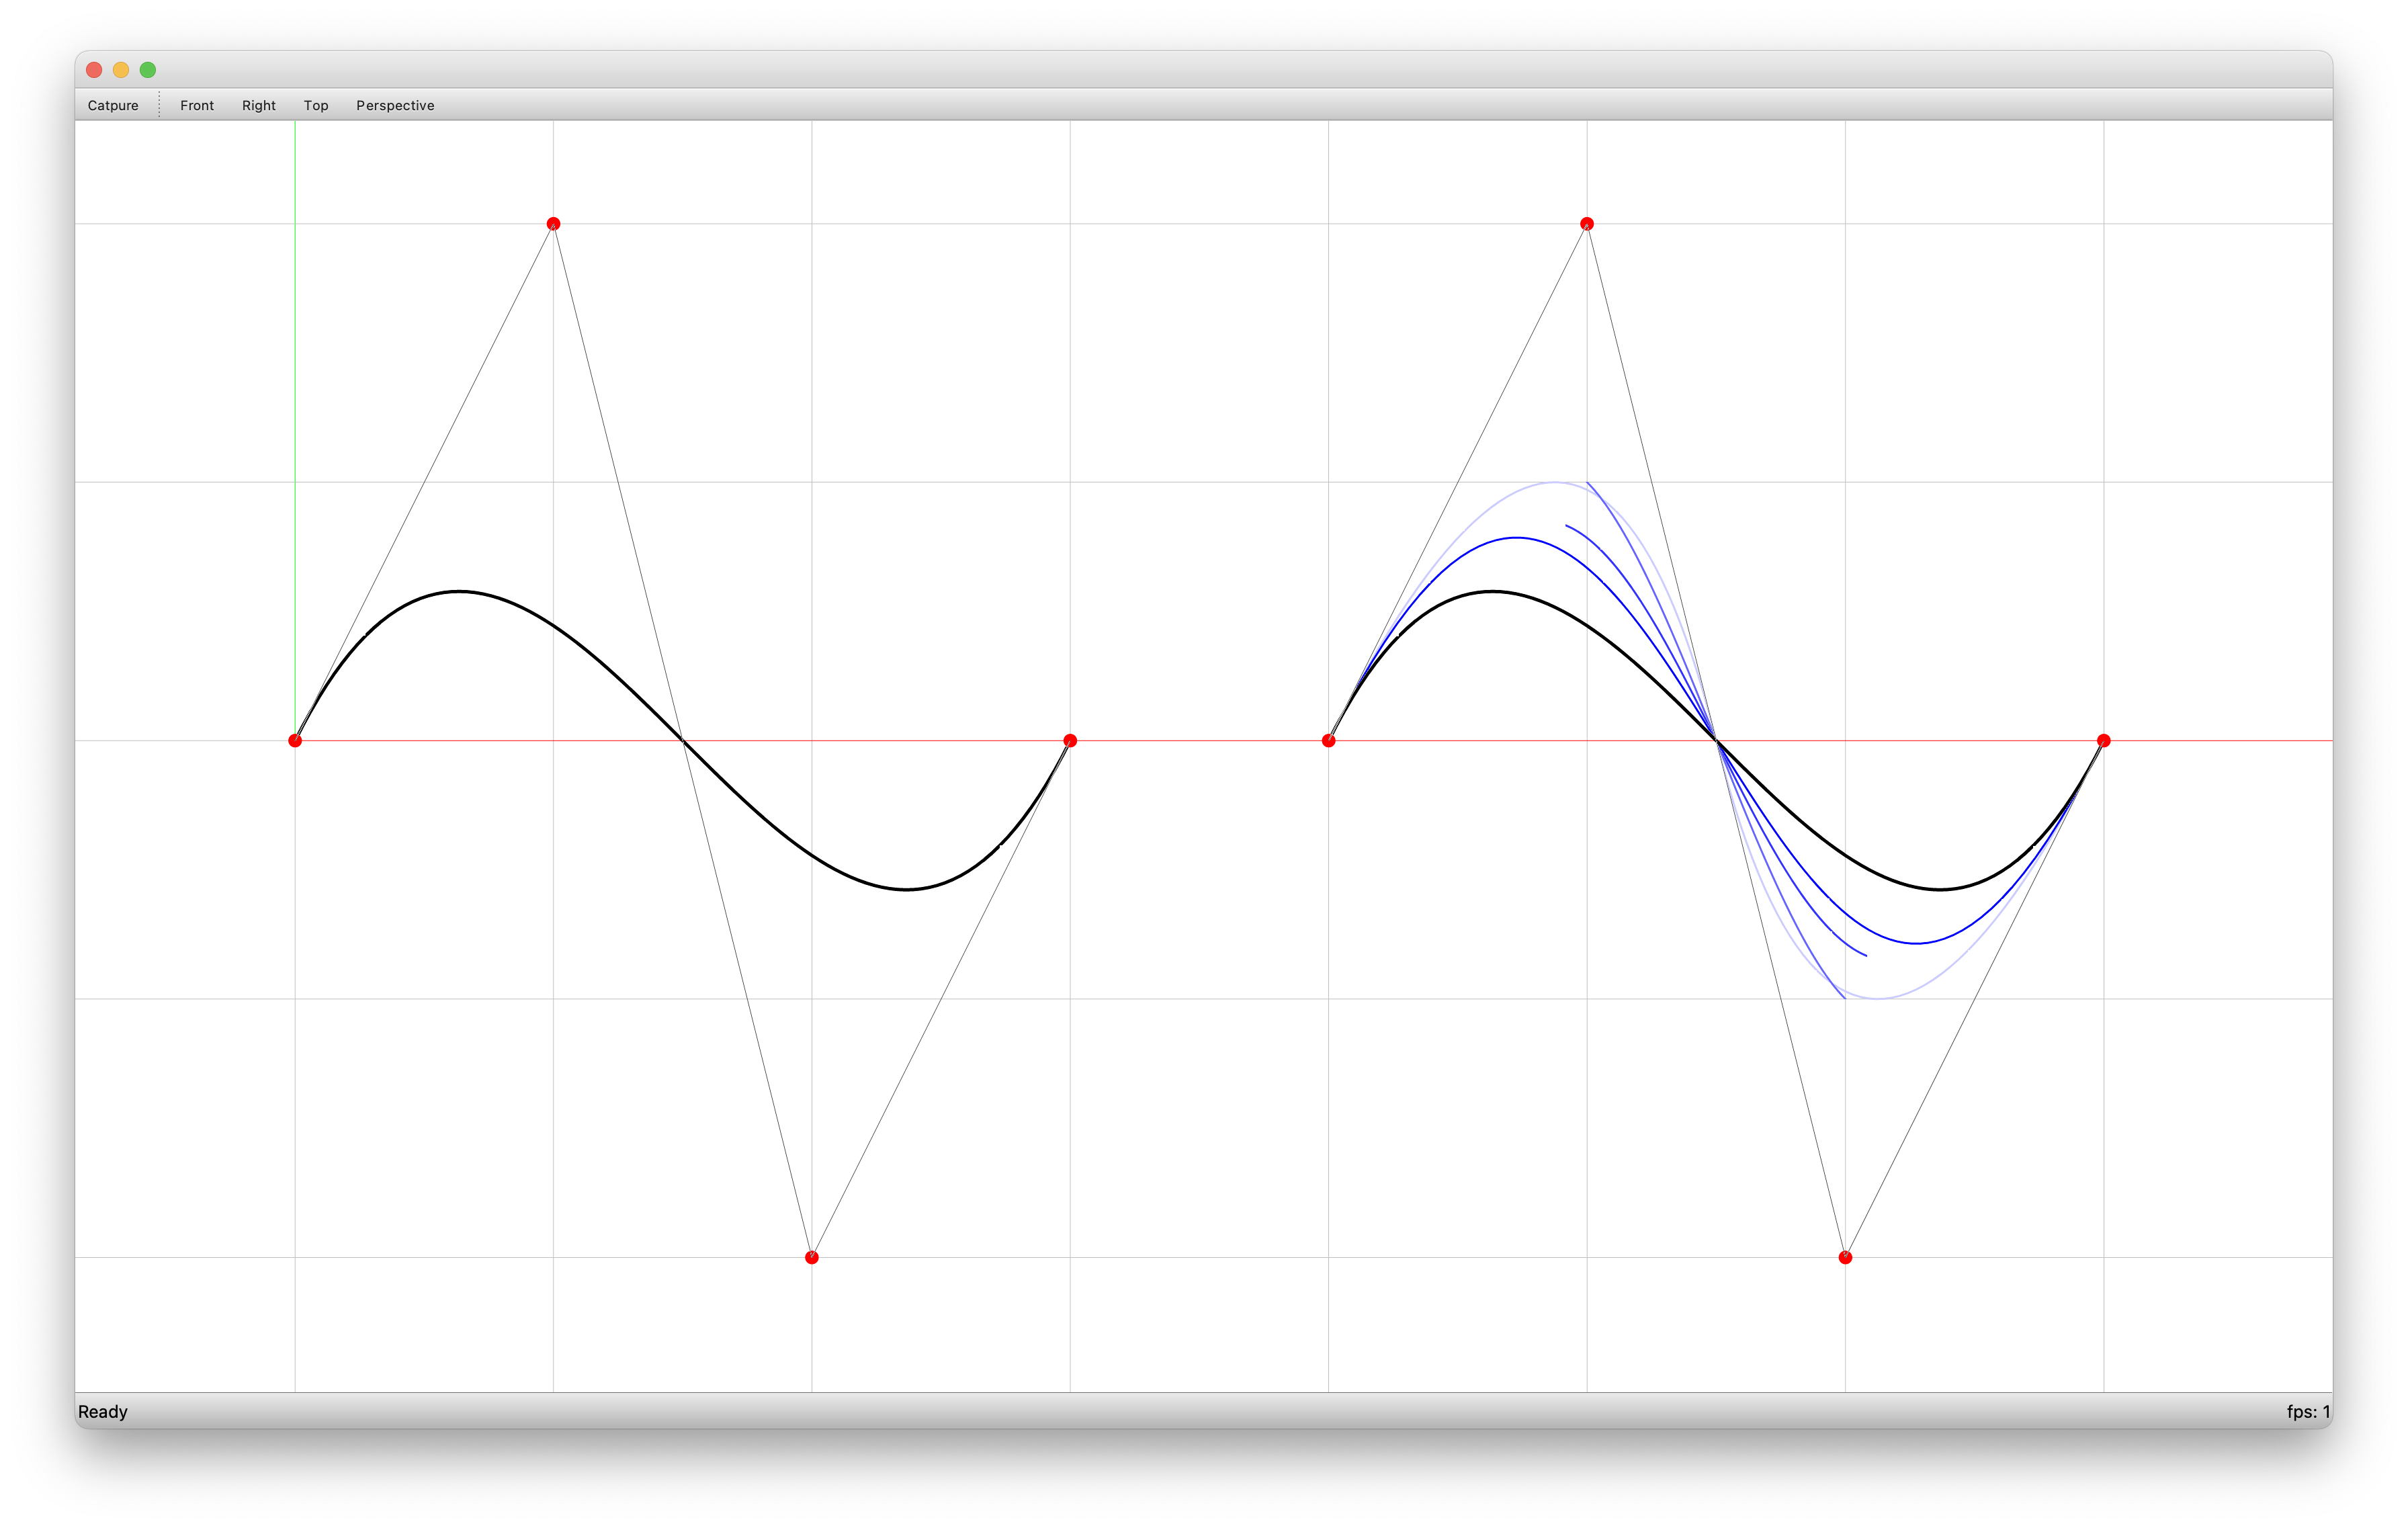
points = [Point(0, 0, 0), Point(1, 2, 0), Point(2, -2, 0), Point(3, 0, 0)]
bezier = Bezier(points)
points = [Point(4, 0, 0), Point(5, 2, 0), Point(6, -2, 0), Point(7, 0, 0)]
curve1 = OCCNurbsCurve.from_parameters(
points=points,
weights=[1.0, 1.0, 1.0, 1.0],
knots=[0.0, 1.0],
multiplicities=[4, 4],
degree=3,
)
curve2 = OCCNurbsCurve.from_parameters(
points=points,
weights=[1.0, 2.0, 2.0, 1.0],
knots=[0.0, 1.0],
multiplicities=[4, 4],
degree=3,
)
curve3 = OCCNurbsCurve.from_parameters(
points=points,
weights=[1.0, 1.0, 1.0, 1.0],
knots=[0.0, 1 / 3, 2 / 3, 1.0],
multiplicities=[3, 1, 1, 3],
degree=3,
)
curve4 = OCCNurbsCurve.from_parameters(
points=points,
weights=[1.0, 1.0, 1.0, 1.0],
knots=[0.0, 1 / 5, 2 / 5, 3 / 5, 4 / 5, 1.0],
multiplicities=[2, 1, 1, 1, 1, 2],
degree=3,
)
curve5 = OCCNurbsCurve.from_parameters(
points=points,
weights=[1.0, 1.0, 1.0, 1.0],
knots=[0.0, 1 / 7, 2 / 7, 3 / 7, 4 / 7, 5 / 7, 6 / 7, 1.0],
multiplicities=[1, 1, 1, 1, 1, 1, 1, 1],
degree=3,
)
curve6 = OCCNurbsCurve.from_parameters(
points=points,
weights=[1.0, 1.0, 1.0, 1.0],
knots=[0.0, 0.5, 1.0],
multiplicities=[3, 1, 3],
degree=2,
)
# ==============================================================================
# Visualisation
# ==============================================================================
view = App()
view.add(
Polyline(bezier.points),
show_points=True,
pointsize=20,
pointcolor=(1, 0, 0),
linewidth=1,
linecolor=(0.3, 0.3, 0.3),
)
view.add(bezier.to_polyline(), linewidth=5, linecolor=(0, 0, 0))
view.add(
Polyline(curve1.points),
show_points=True,
pointsize=20,
pointcolor=(1, 0, 0),
linewidth=1,
linecolor=(0.3, 0.3, 0.3),
)
view.add(curve1.to_polyline(), linewidth=5, linecolor=(0, 0, 0))
view.add(curve2.to_polyline(), linewidth=3, linecolor=(0, 0, 1))
view.add(curve3.to_polyline(), linewidth=3, linecolor=(0.2, 0.2, 1))
view.add(curve4.to_polyline(), linewidth=3, linecolor=(0.4, 0.4, 1))
view.add(curve5.to_polyline(), linewidth=3, linecolor=(0.6, 0.6, 1))
view.add(curve6.to_polyline(), linewidth=3, linecolor=(0.8, 0.8, 1))
view.run()