2. Visualization in grasshopper
This tutorial gives an overview of how the results of the slicing process can be visualized in Rhino grasshopper. It is important to note that the grasshopper components do not run any slicing code, they merely visualize existing results, that have been generated using python.
2.1. Installation
To install the grasshopper components see the installation page.
2.2. Overview
When compas_slicer code is run for a project my_project, then the folder my_project/data/output/ is created, where all the intermediary and final results of the slicing process are saved in the form of json files. The grasshopper components look into that folder, load the according json file, and turn it into geometry that can be visualized. To find the correct folder, the grasshopper file that contains the components needs to be positioned in the my_project folder. You can look at the compas_slicer/examples to see the way the grasshopper components are used.
2.3. Workflow
When the compas_slicer python code is run, then all the json files that are recalculated are overwritten in the output folder. To update the visualization in grasshopper we click on the button recompute that is on the top of each component. This loads the latest version of the according json file from the output folder.
2.4. Components
The components that exist correspond to the main classes of data types from compas_slicer that someone might want to visualize. The components that are currently available include the following:
csLoadSlicer
Loads the compas_slicer.slicers.Base_slicer class and all classes that inherit from it, with all the attributes stored in the class.
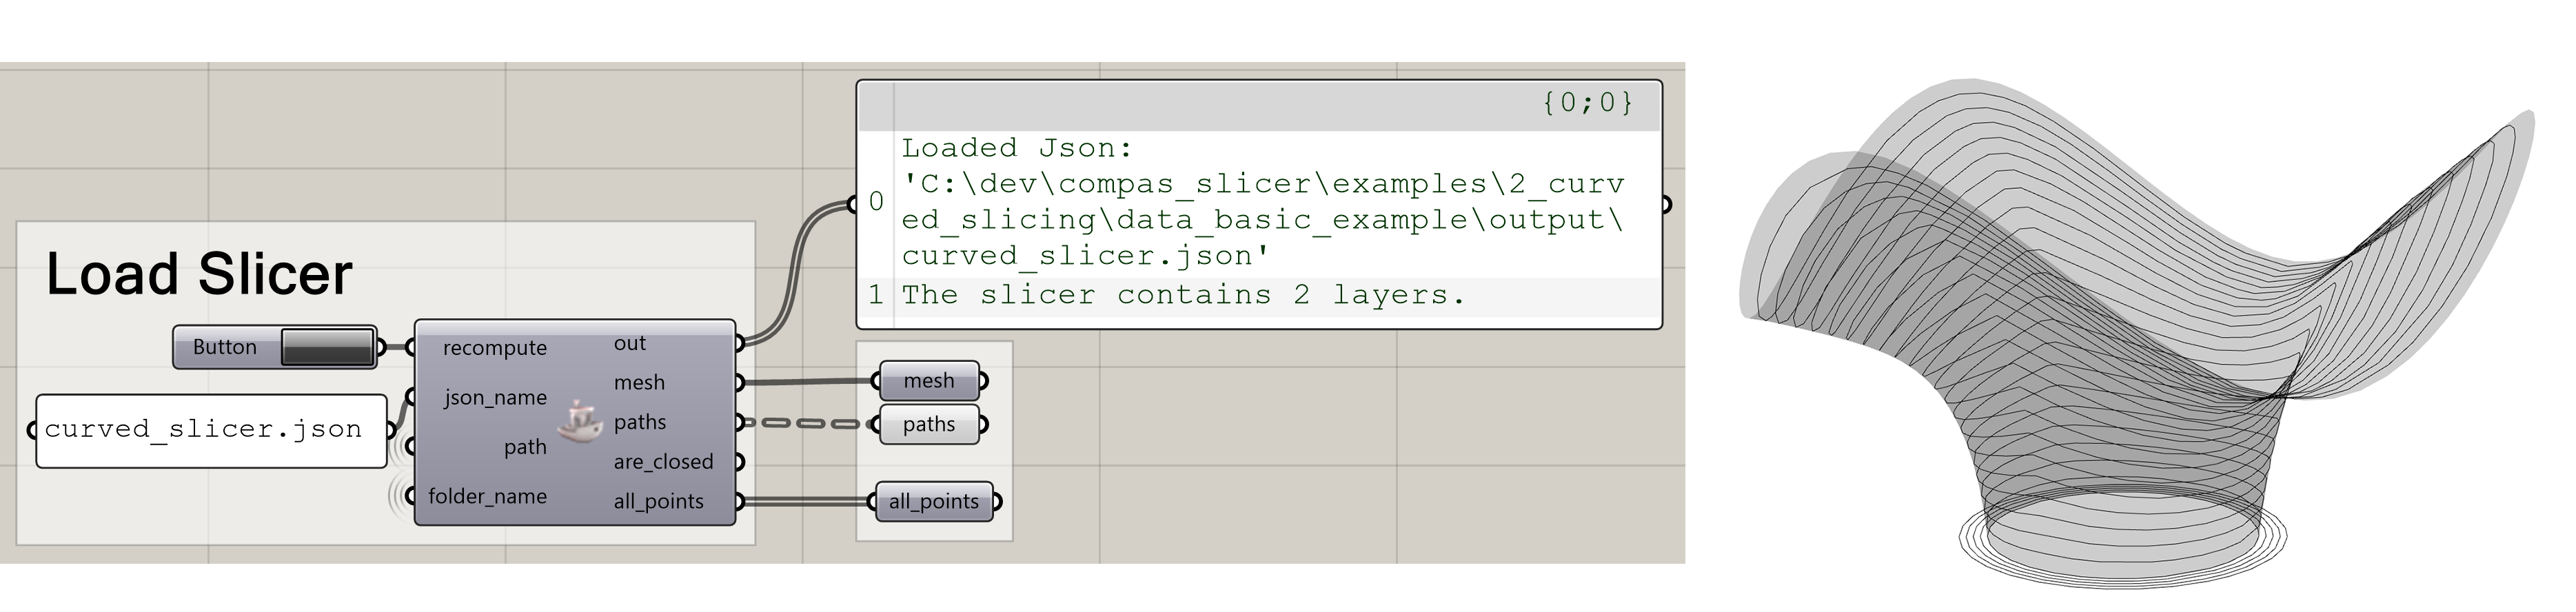
Loading the slicer results.
csLoadPrintpoints
Loads the Printpoints dictionary with all the data stored in the compas_slicer.geometry.PrintPoint class.
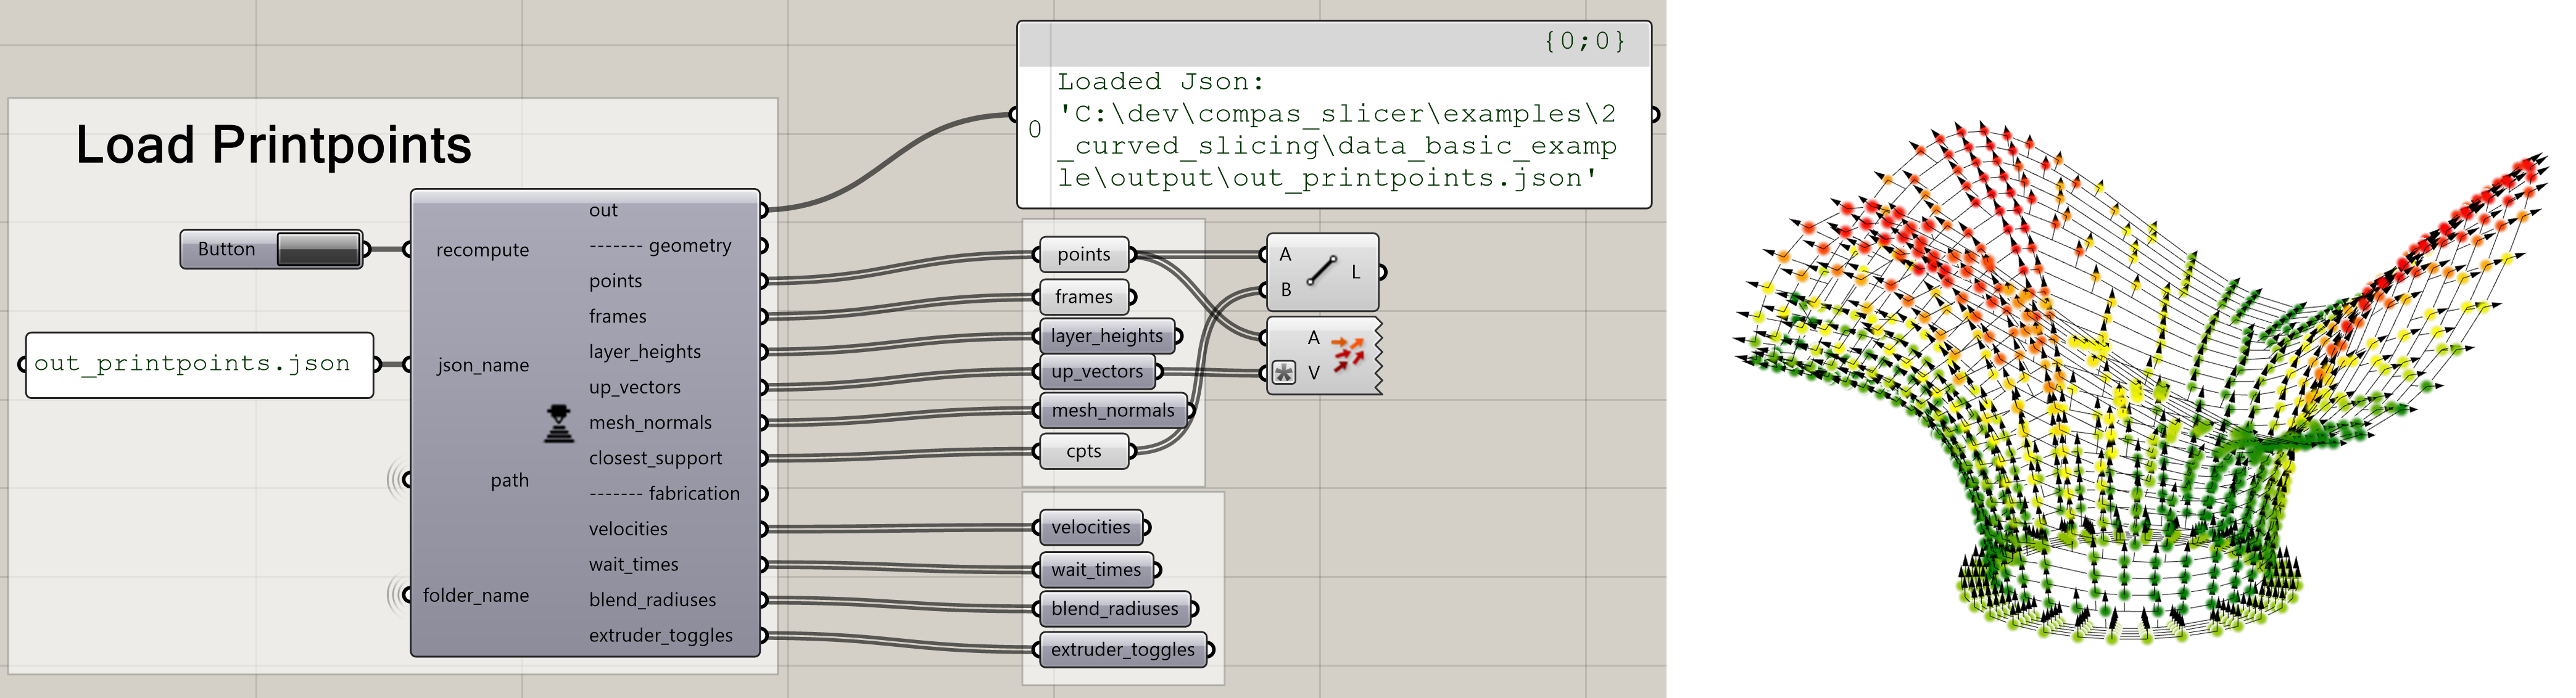
Loading the outputted printpoints information.
csLightPathViz
Creates a lightweight visualization of the paths. The print paths are displayed with white tubes, and the traveling paths are displayed with orange tubes.
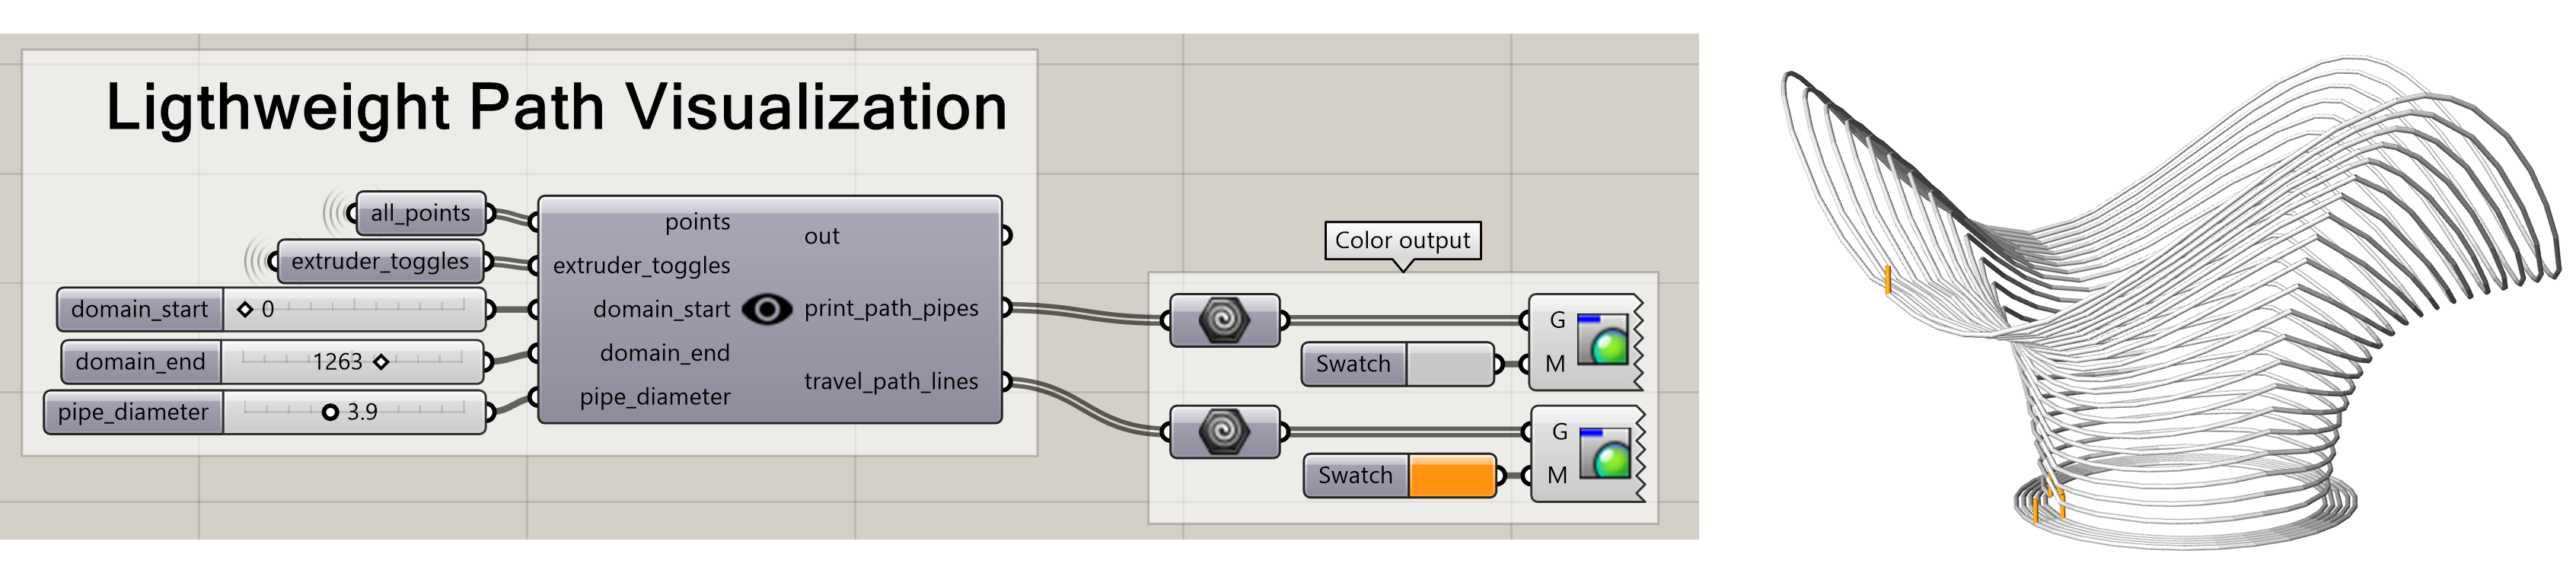
Lightweight paths visualization.
csRenderPathViz
If the user provides a cross-section of the paths, then a more expensive visualization can be created, where each path is displayed with its cross-sectional geometry.
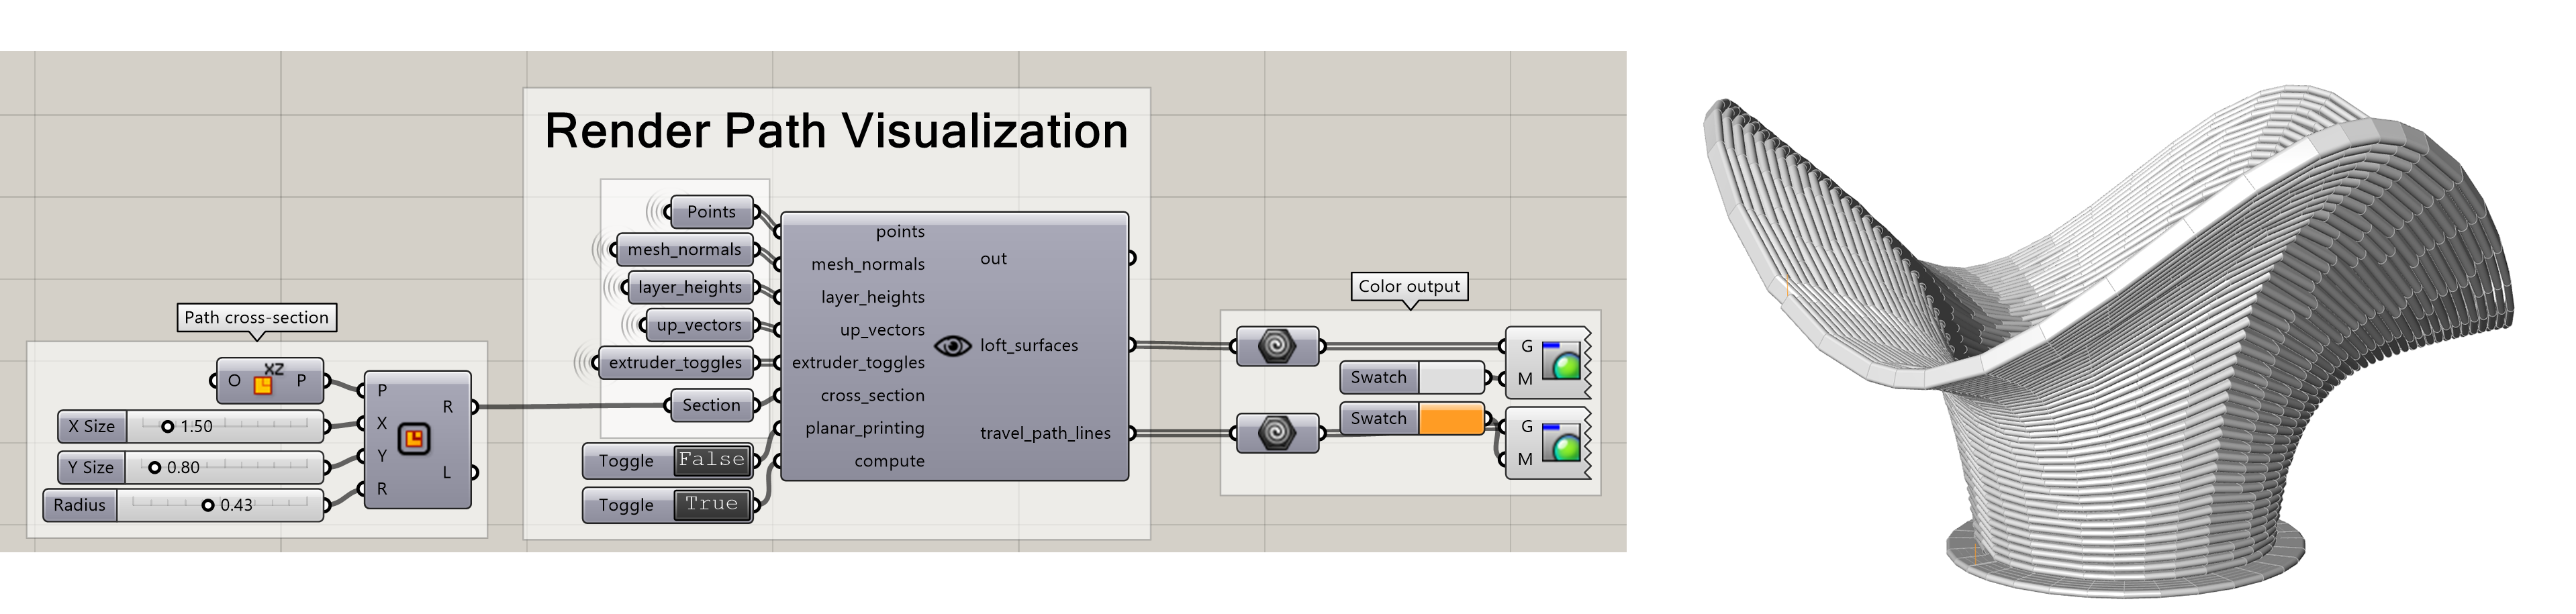
Render paths visualization.