from compas_viewer import Viewer
from compas.colors import Color
from compas.geometry import NurbsCurve
from compas.geometry import Point
from compas.geometry import Polyline
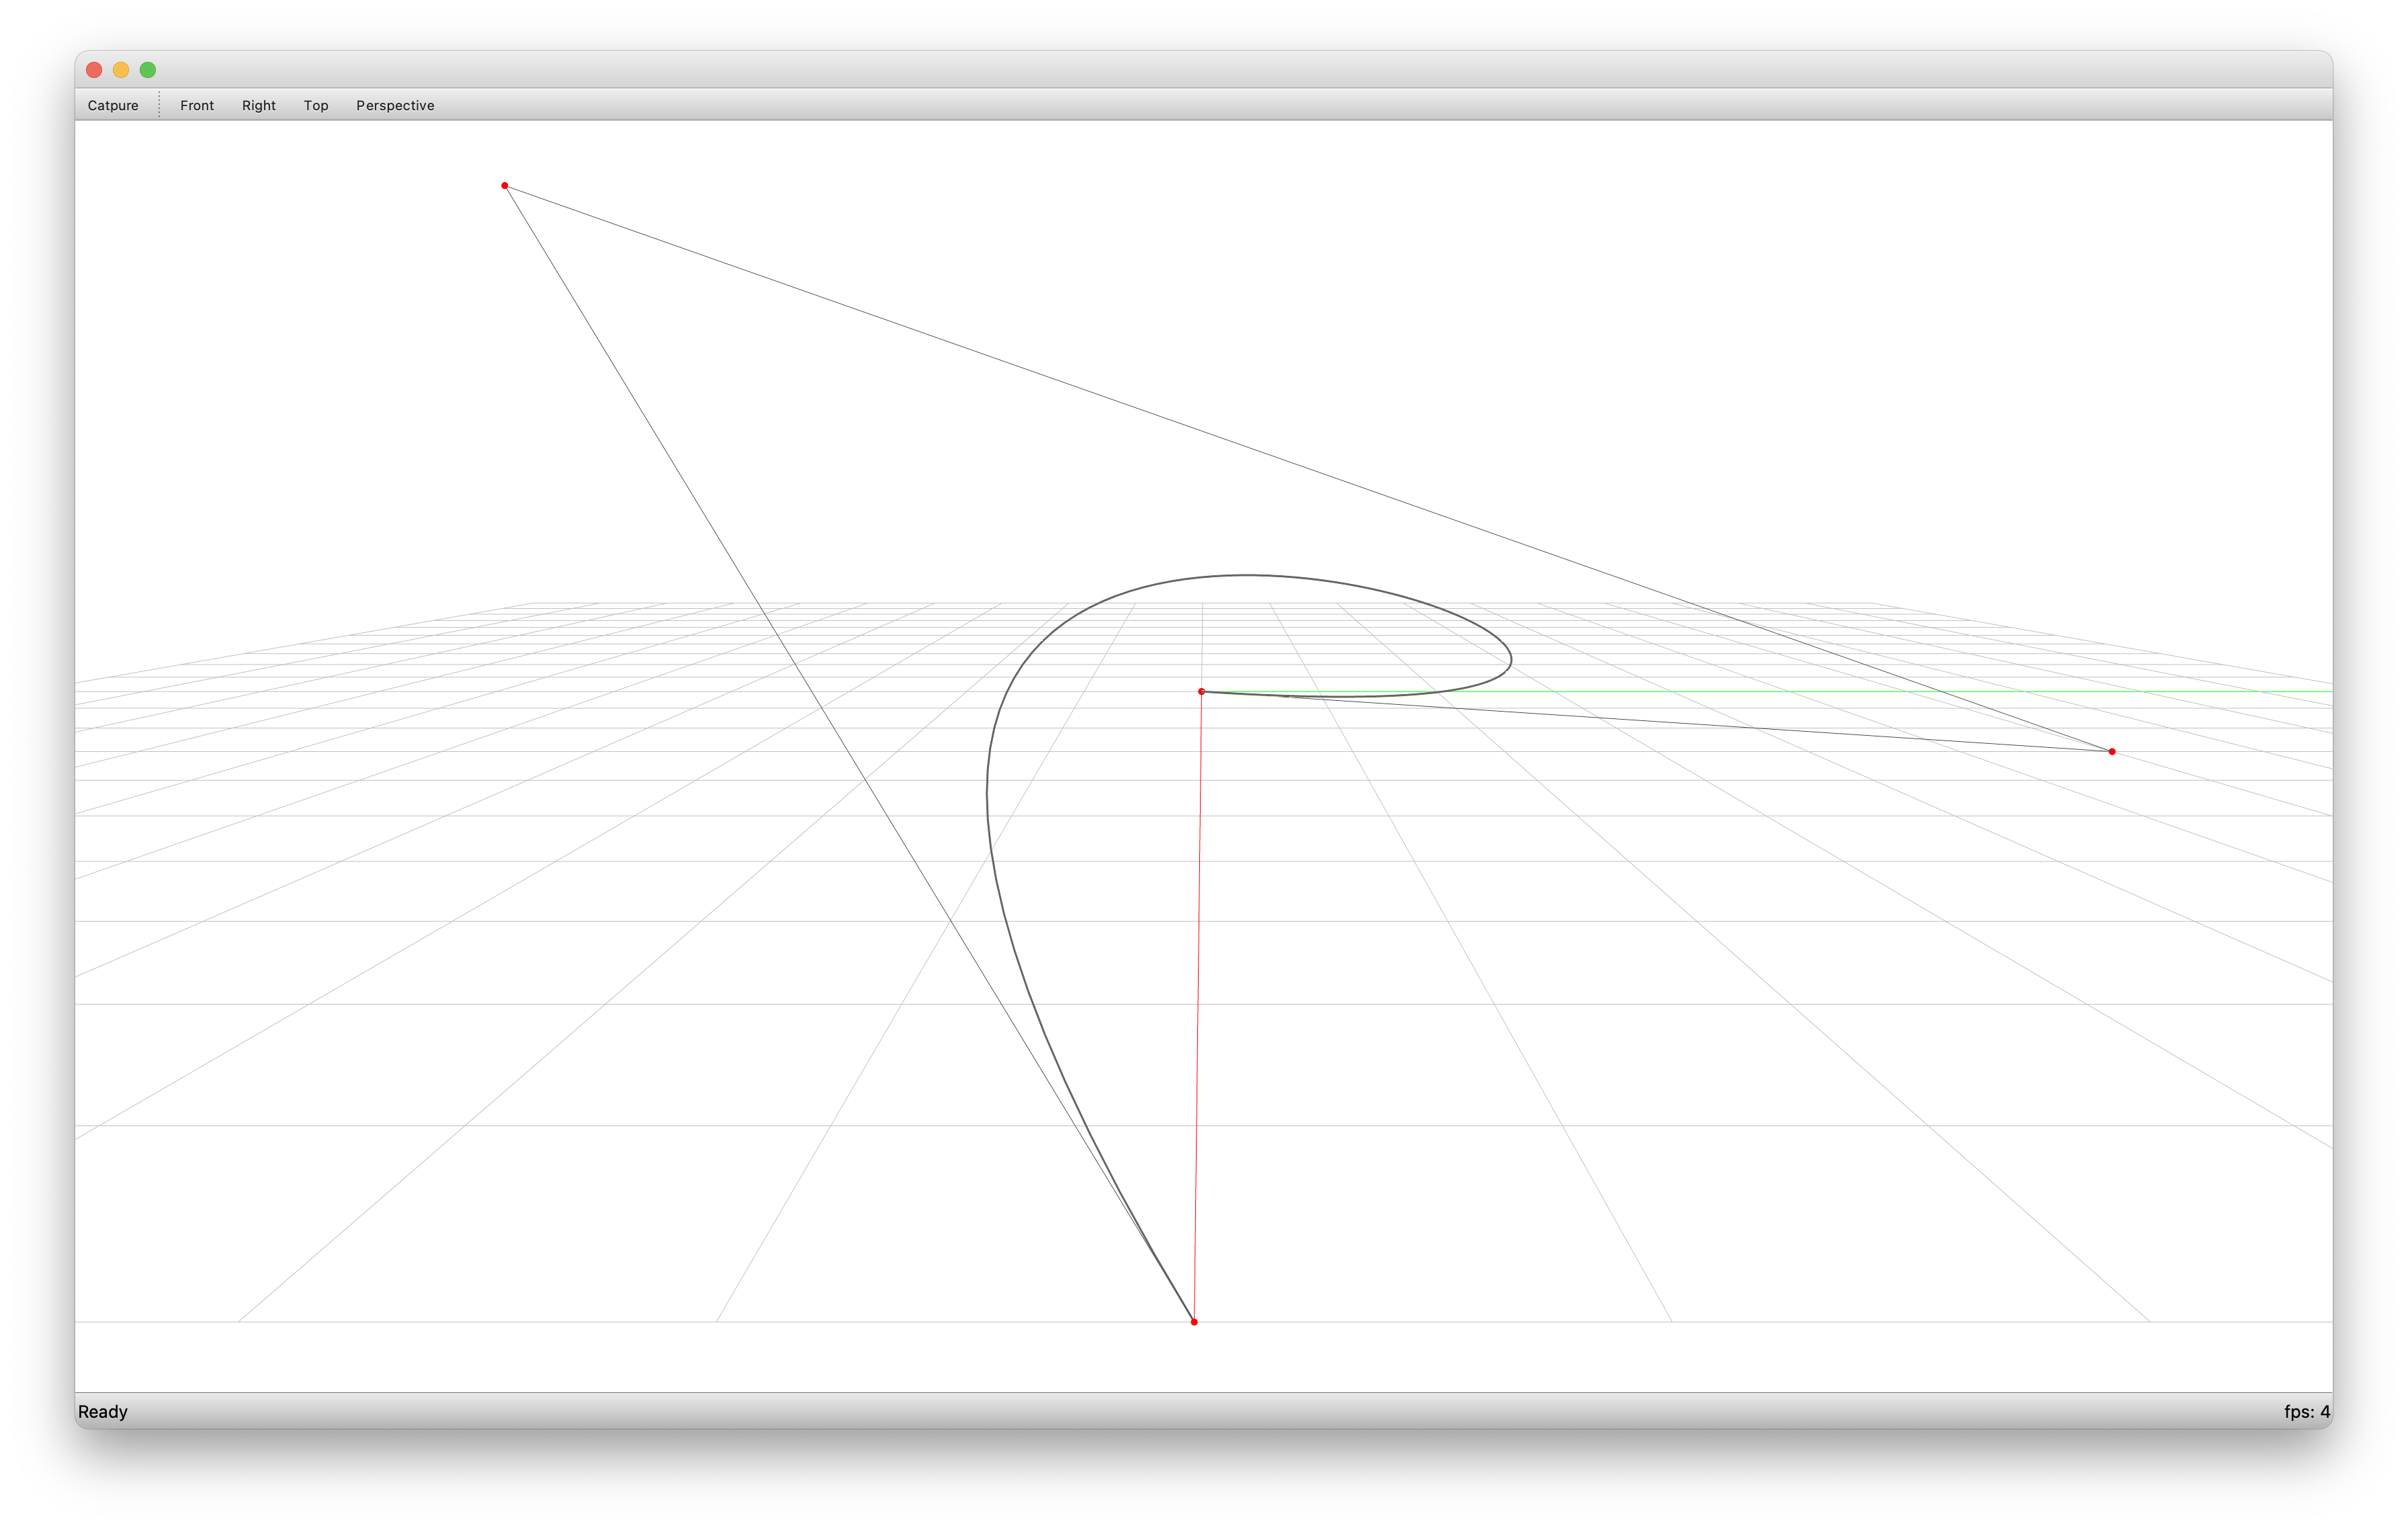
points = [Point(0, 0, 0), Point(3, 6, 0), Point(6, -3, 3), Point(10, 0, 0)]
curve = NurbsCurve.from_points(points)
# ==============================================================================
# Visualisation
# ==============================================================================
viewer = Viewer()
viewer.scene.add(curve, linewidth=3)
viewer.scene.add(
Polyline(curve.points),
show_points=True,
pointsize=20,
pointcolor=Color.red(),
linewidth=1,
linecolor=Color(0.3, 0.3, 0.3),
)
viewer.show()