from compas_viewer import Viewer
from compas.colors import Color
from compas.geometry import NurbsCurve
from compas.geometry import Point
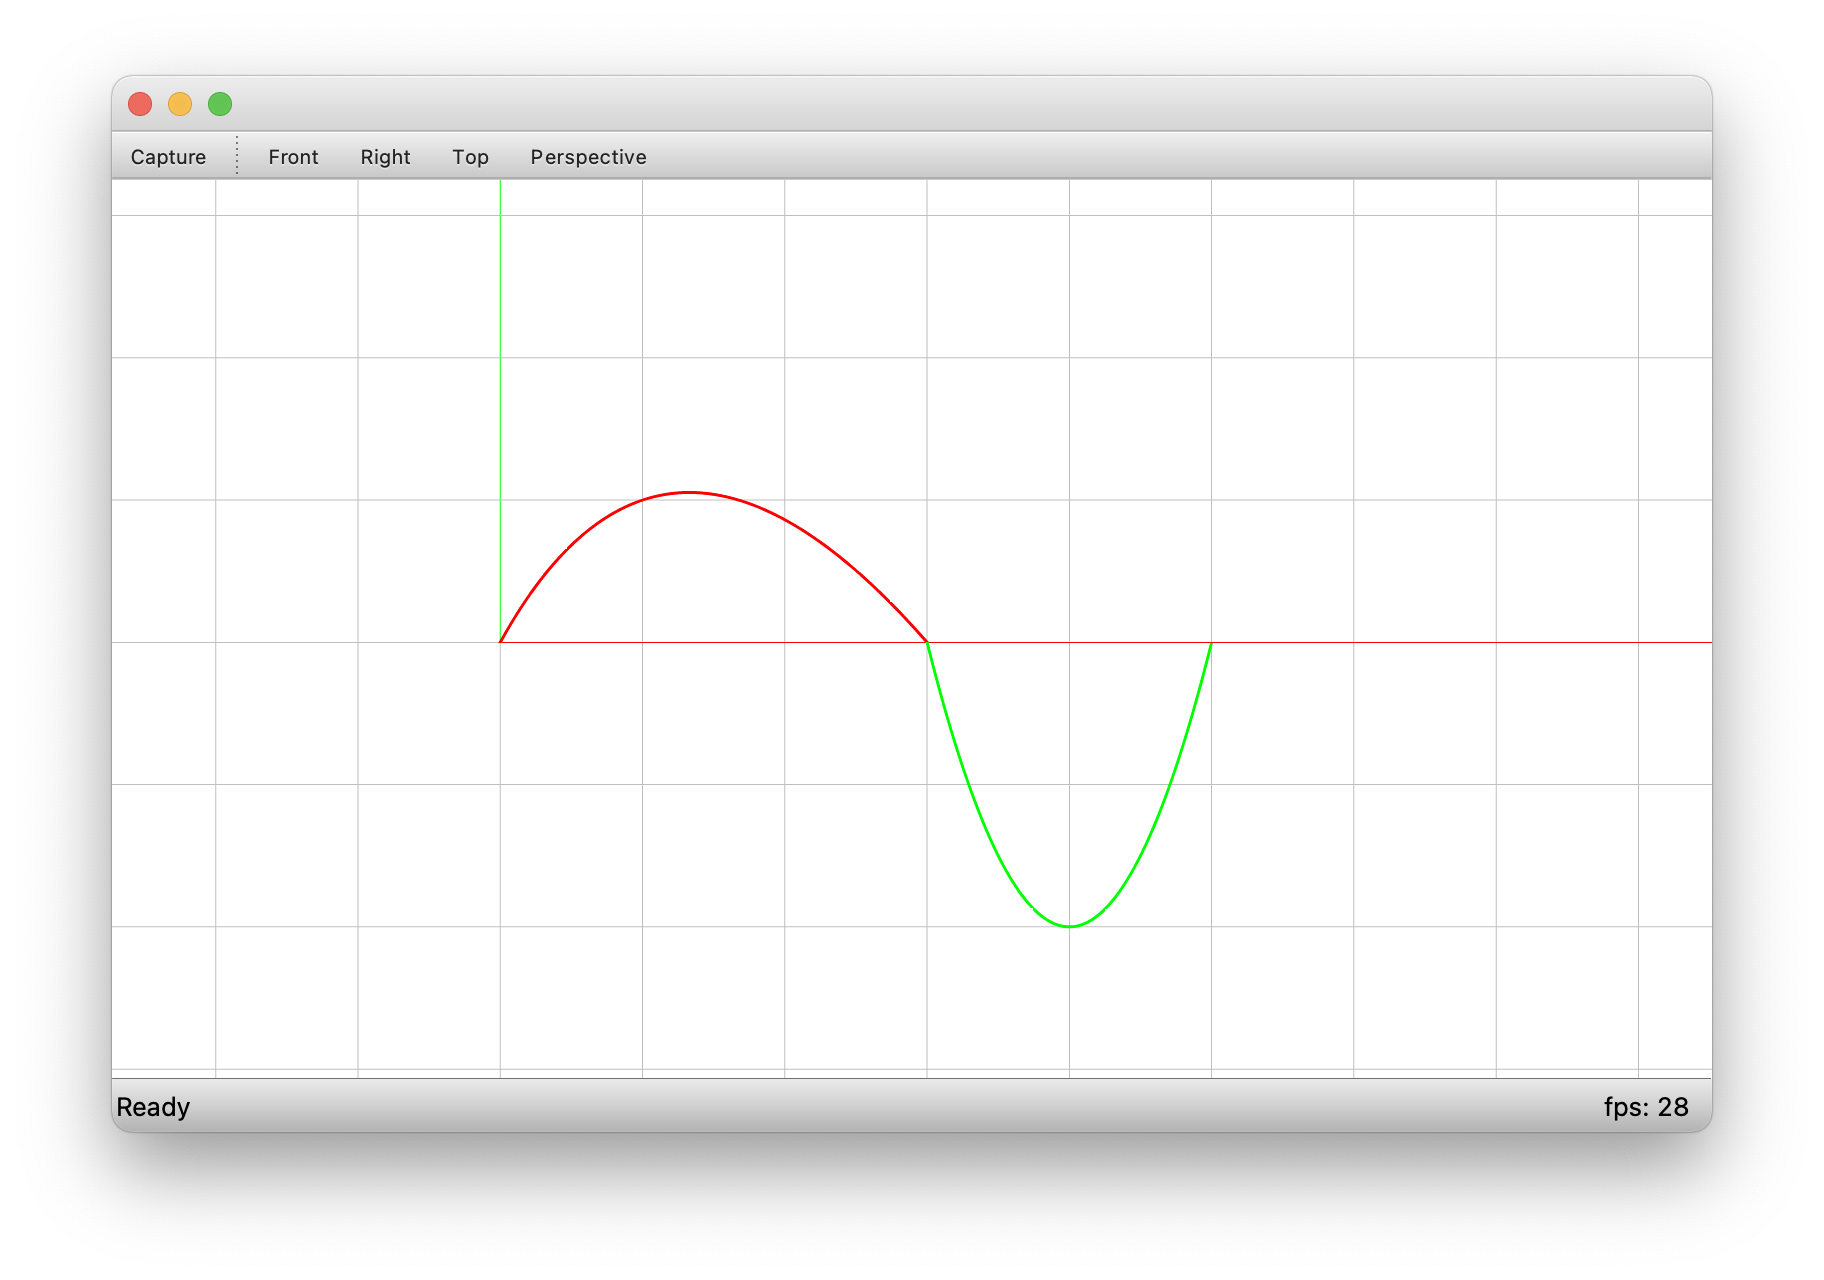
points1 = [Point(0, 0, 0), Point(1, 1, 0), Point(3, 0, 0)]
points2 = [Point(3, 0, 0), Point(4, -2, 0), Point(5, 0, 0)]
curve1 = NurbsCurve.from_interpolation(points1)
curve2 = NurbsCurve.from_interpolation(points2)
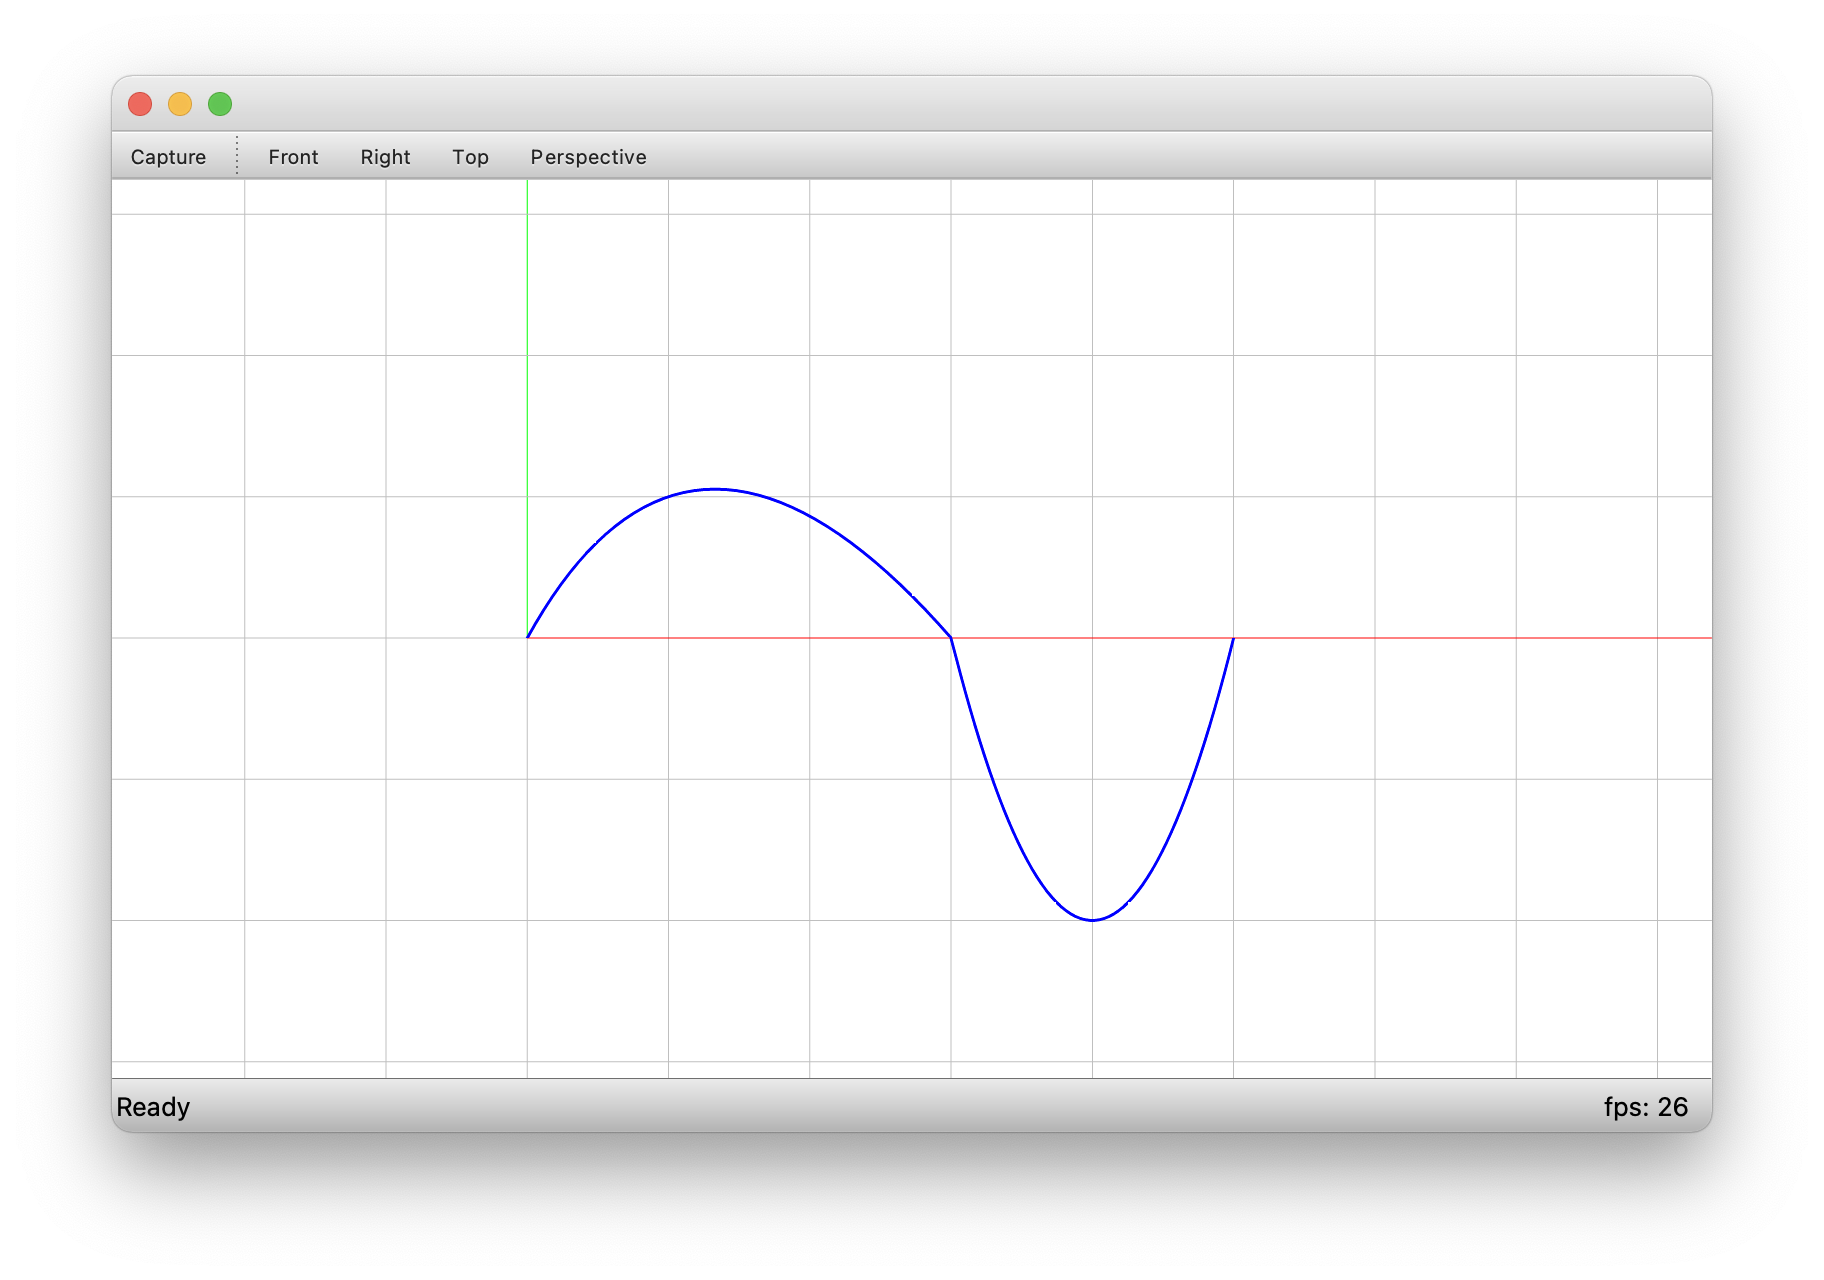
joined = curve1.joined(curve2)
# ==============================================================================
# Visualisation
# ==============================================================================
viewer = Viewer()
viewer.scene.add(curve1, linewidth=3, linecolor=Color.red(), name="Red")
viewer.scene.add(curve2, linewidth=3, linecolor=Color.green(), name="Green")
viewer.scene.add(joined, linewidth=3, linecolor=Color.blue(), name="Blue")
viewer.show()