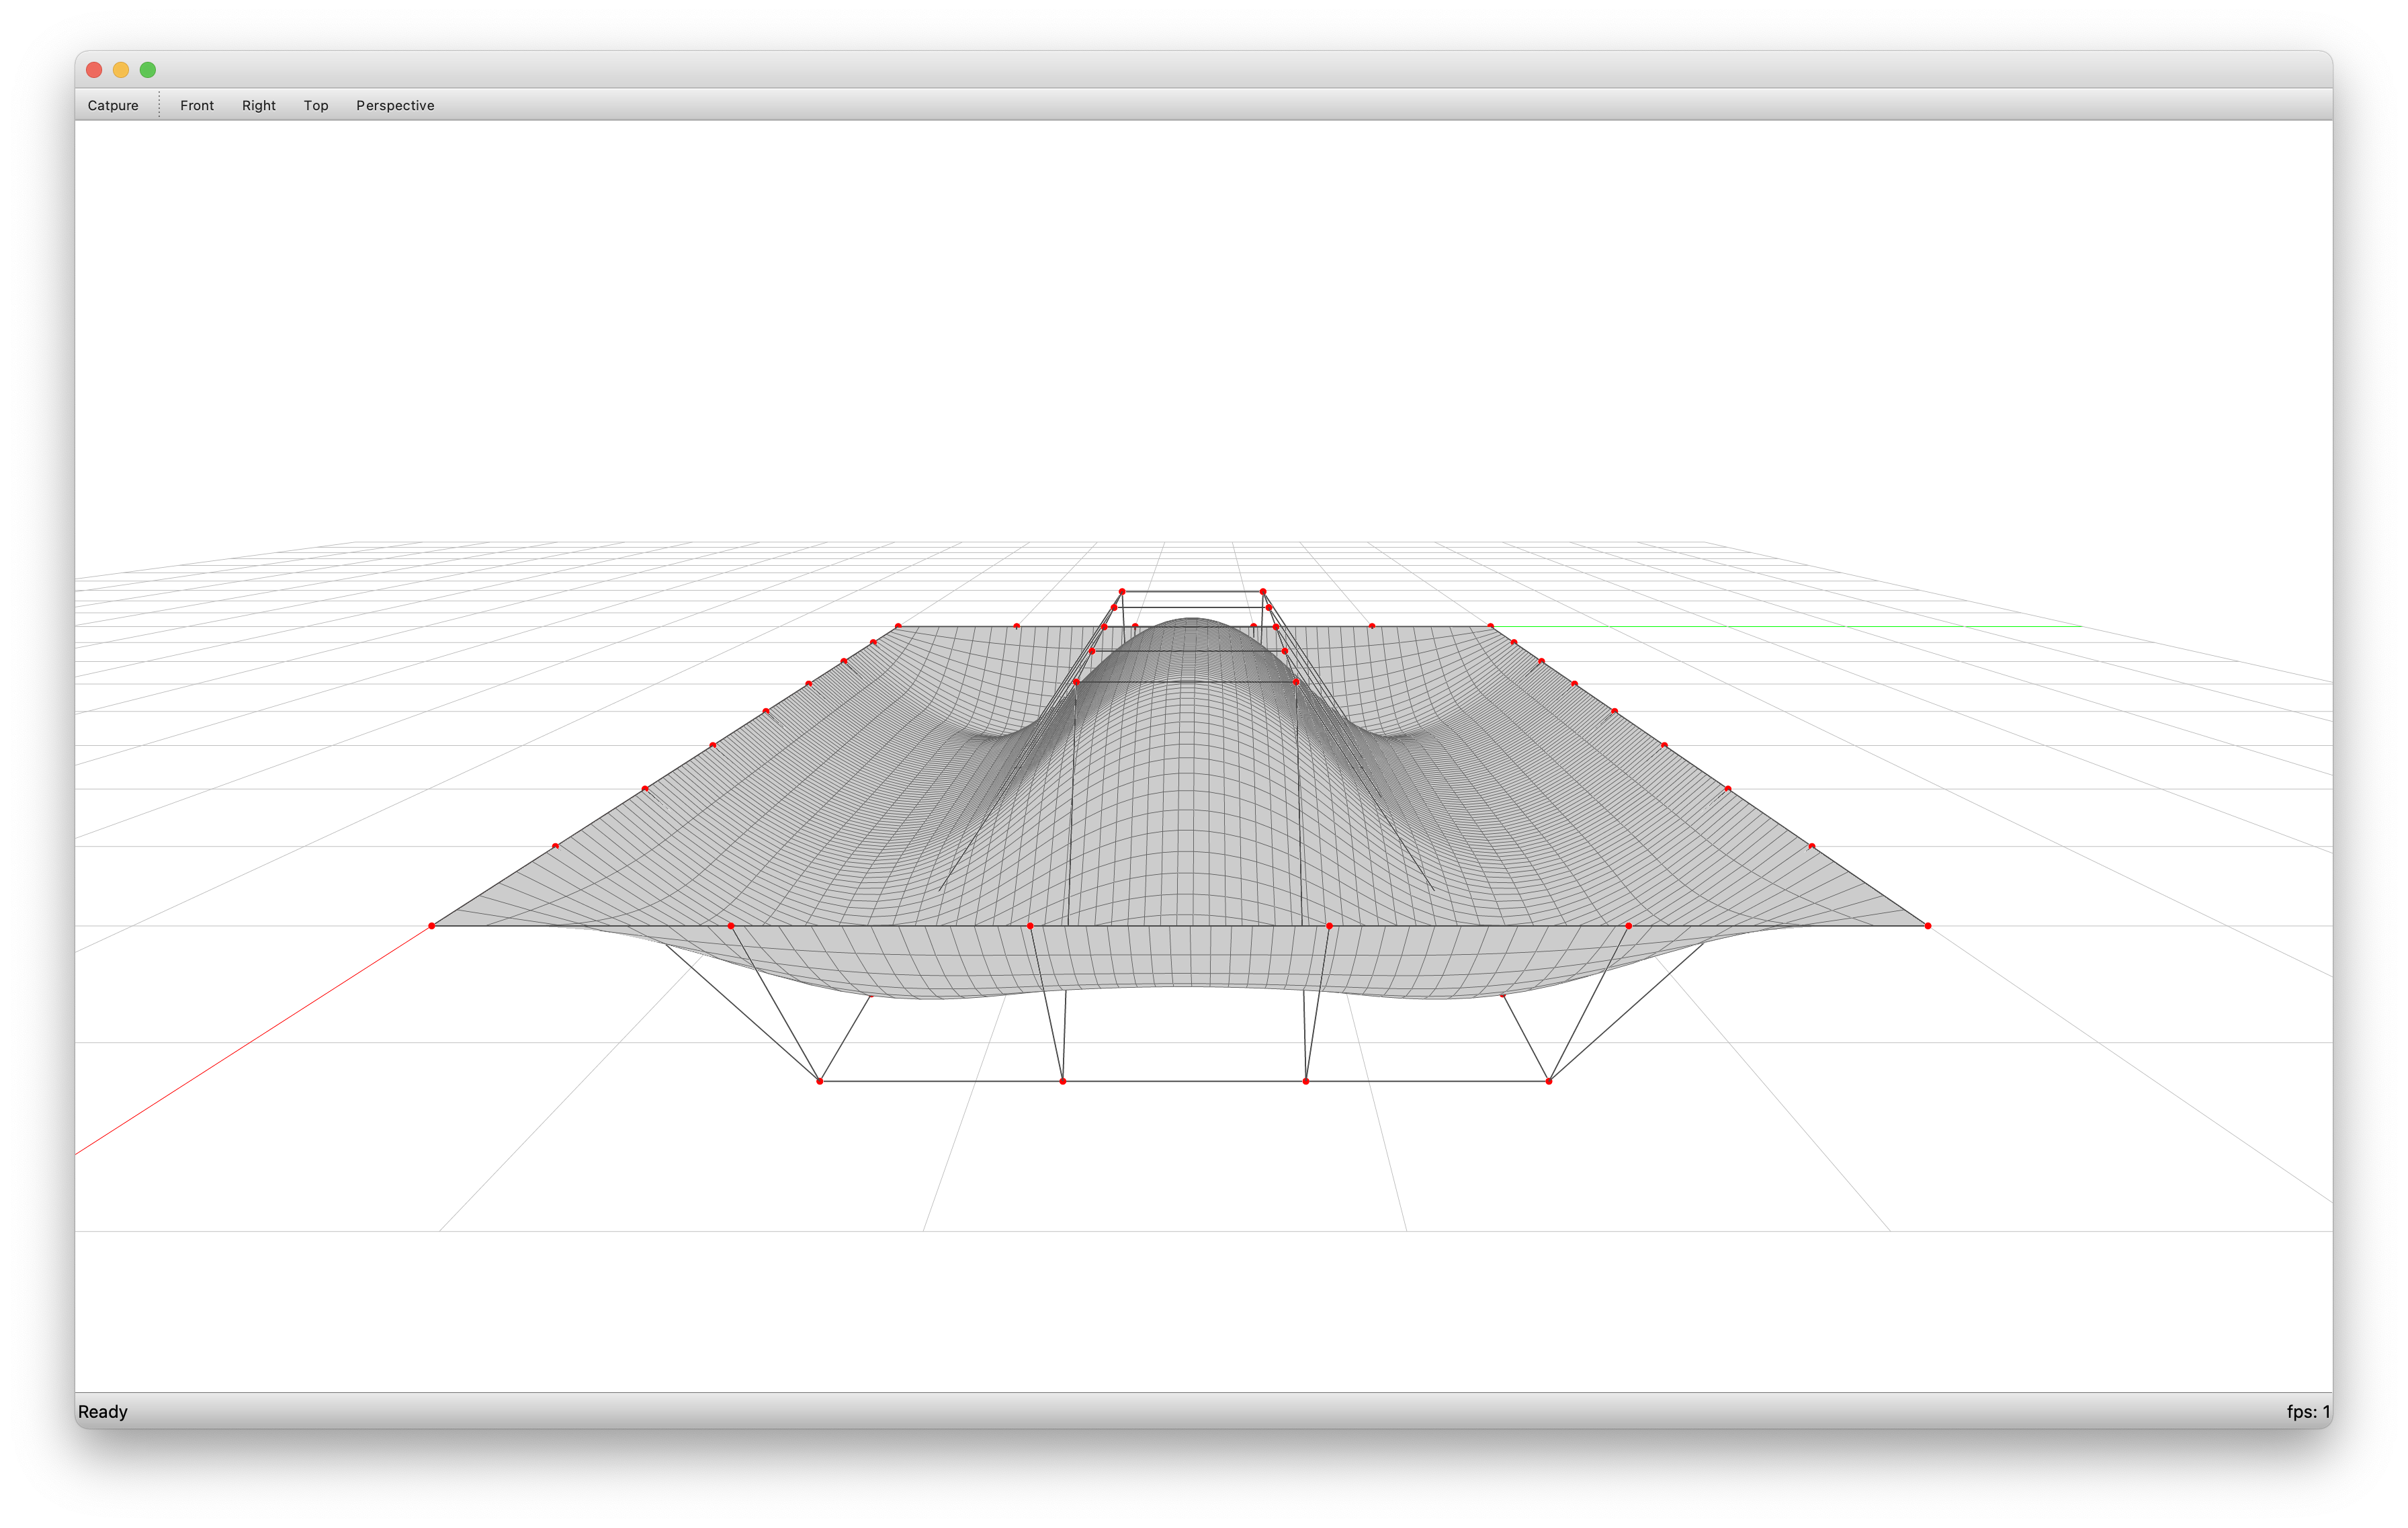
from compas_viewer import Viewer

from compas.colors import Color
from compas.geometry import NurbsSurface
from compas.geometry import Point
from compas.geometry import Polyline
from compas.itertools import linspace
from compas.itertools import meshgrid

UU, VV = meshgrid(linspace(0, 8, 9), linspace(0, 5, 6))

Z = 0.5

points = []
for i, (U, V) in enumerate(zip(UU, VV)):
    row = []
    for j, (u, v) in enumerate(zip(U, V)):
        if i == 0 or i == 5 or j == 0 or j == 8:
            z = 0.0
        elif i < 2 or i > 3:
            z = -1.0
        else:
            if j < 2 or j > 6:
                z = -1.0
            else:
                z = Z
        row.append(Point(u, v, z))
    points.append(row)

surface = NurbsSurface.from_points(points=points)

# ==============================================================================
# Visualisation
# ==============================================================================

viewer = Viewer()

viewer.scene.add(surface)

# control polygon

points = list(surface.points)
viewer.scene.add([Polyline(row) for row in points], linewidth=1, linecolor=Color(0.3, 0.3, 0.3))
viewer.scene.add([Polyline(col) for col in zip(*points)], linewidth=1, linecolor=Color(0.3, 0.3, 0.3))
viewer.scene.add(points, pointsize=10)

# isocurves

u_curves = []
for u in surface.space_u(17):  # type: ignore
    u_curves.append(surface.isocurve_u(u).to_polyline())

v_curves = []
for v in surface.space_v(17):  # type: ignore
    v_curves.append(surface.isocurve_v(v).to_polyline())

viewer.scene.add(u_curves, linecolor=Color(0.8, 0.8, 0.8), linewidth=3)
viewer.scene.add(v_curves, linecolor=Color(0.8, 0.8, 0.8), linewidth=3)

viewer.show()
