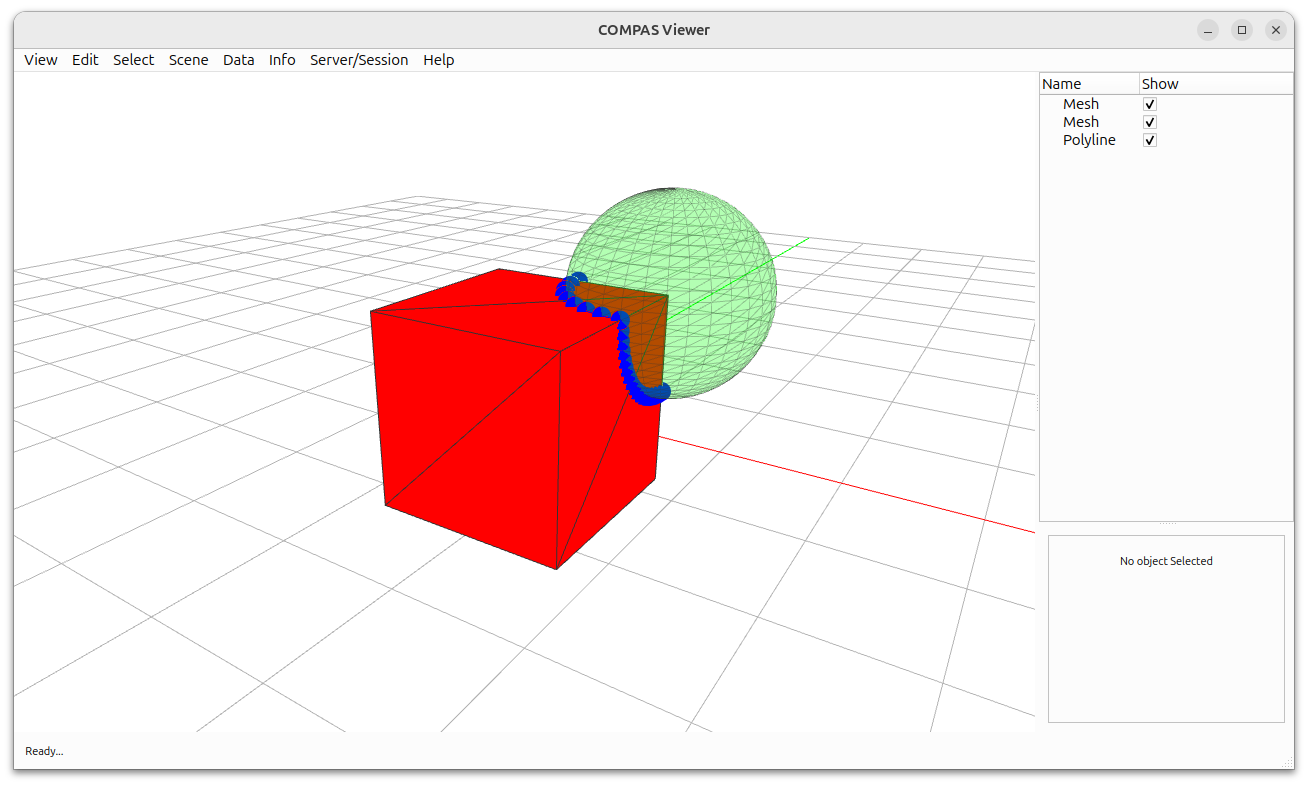
Mesh Intersections
This example demonstrates how to compute intersections between two triangle meshes using COMPAS CGAL.
Key Features:
Computing intersection curves between meshes
Visualizing intersection results
Handling multiple intersection curves
from compas.datastructures import Mesh
from compas.geometry import Box
from compas.geometry import Point
from compas.geometry import Polyline
from compas.geometry import Sphere
from compas_viewer import Viewer

from compas_cgal.intersections import intersection_mesh_mesh


def main():
    # ==============================================================================
    # Make a box and a sphere
    # ==============================================================================

    box = Box(2)
    A = box.to_vertices_and_faces(triangulated=True)

    sphere = Sphere(1, point=[1, 1, 1])
    B = sphere.to_vertices_and_faces(u=32, v=32, triangulated=True)

    # ==============================================================================
    # Compute the intersections
    # ==============================================================================

    pointsets = intersection_mesh_mesh(A, B)

    # ==============================================================================
    # Process output
    # ==============================================================================

    polylines = []
    for points in pointsets:
        points = [Point(*point) for point in points]
        polyline = Polyline(points)
        polylines.append(polyline)

    return A, B, polylines


A, B, polylines = main()

# =============================================================================
# Visualize
# ==============================================================================

viewer = Viewer()

viewer.renderer.camera.target = [0, 0, 0]
viewer.renderer.camera.position = [4, -6, 3]

viewer.scene.add(Mesh.from_vertices_and_faces(*A), facecolor=(1.0, 0.0, 0.0), show_points=False)
viewer.scene.add(
    Mesh.from_vertices_and_faces(*B),
    facecolor=(0.0, 1.0, 0.0),
    show_points=False,
    opacity=0.3,
)

for polyline in polylines:
    viewer.scene.add(
        polyline,
        linecolor=(0.0, 0.0, 1.0),
        lineswidth=3,
        pointcolor=(0.0, 0.0, 1.0),
        pointsize=20,
        show_points=True,
    )

viewer.show()