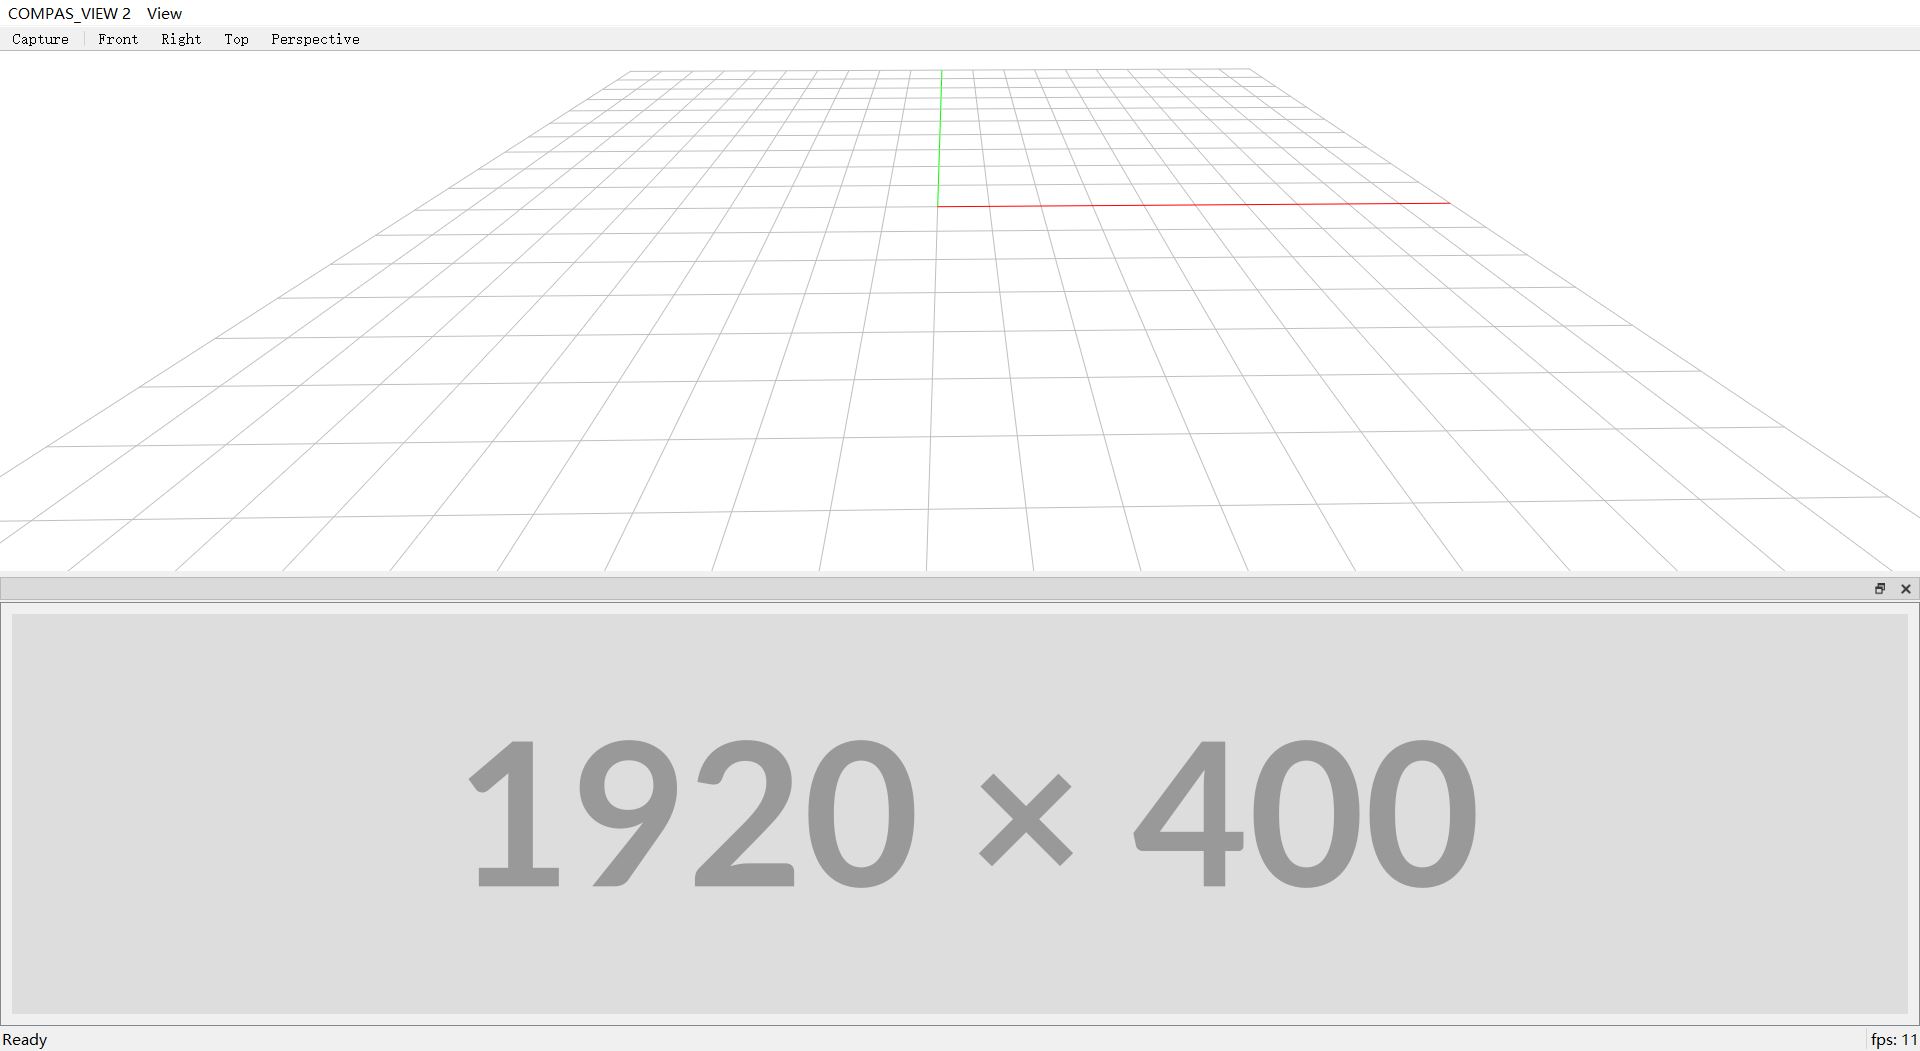
Image Display
import compas_view2
import matplotlib.image as mpimg


viewer = compas_view2.app.App(width=1920, height=1080)  # Create a compas_view2 viewer

figure = viewer.plot(min_height=450)  # Create a figure within the viewer to display the image

img_src = compas_view2.get("/imag_1920_400_placehold.png")  # Load the image
image_data = mpimg.imread(img_src)

figure.figimage(image_data, cmap="gray", interpolation="nearest")  # Display the image on the figure

viewer.show()
Advanced
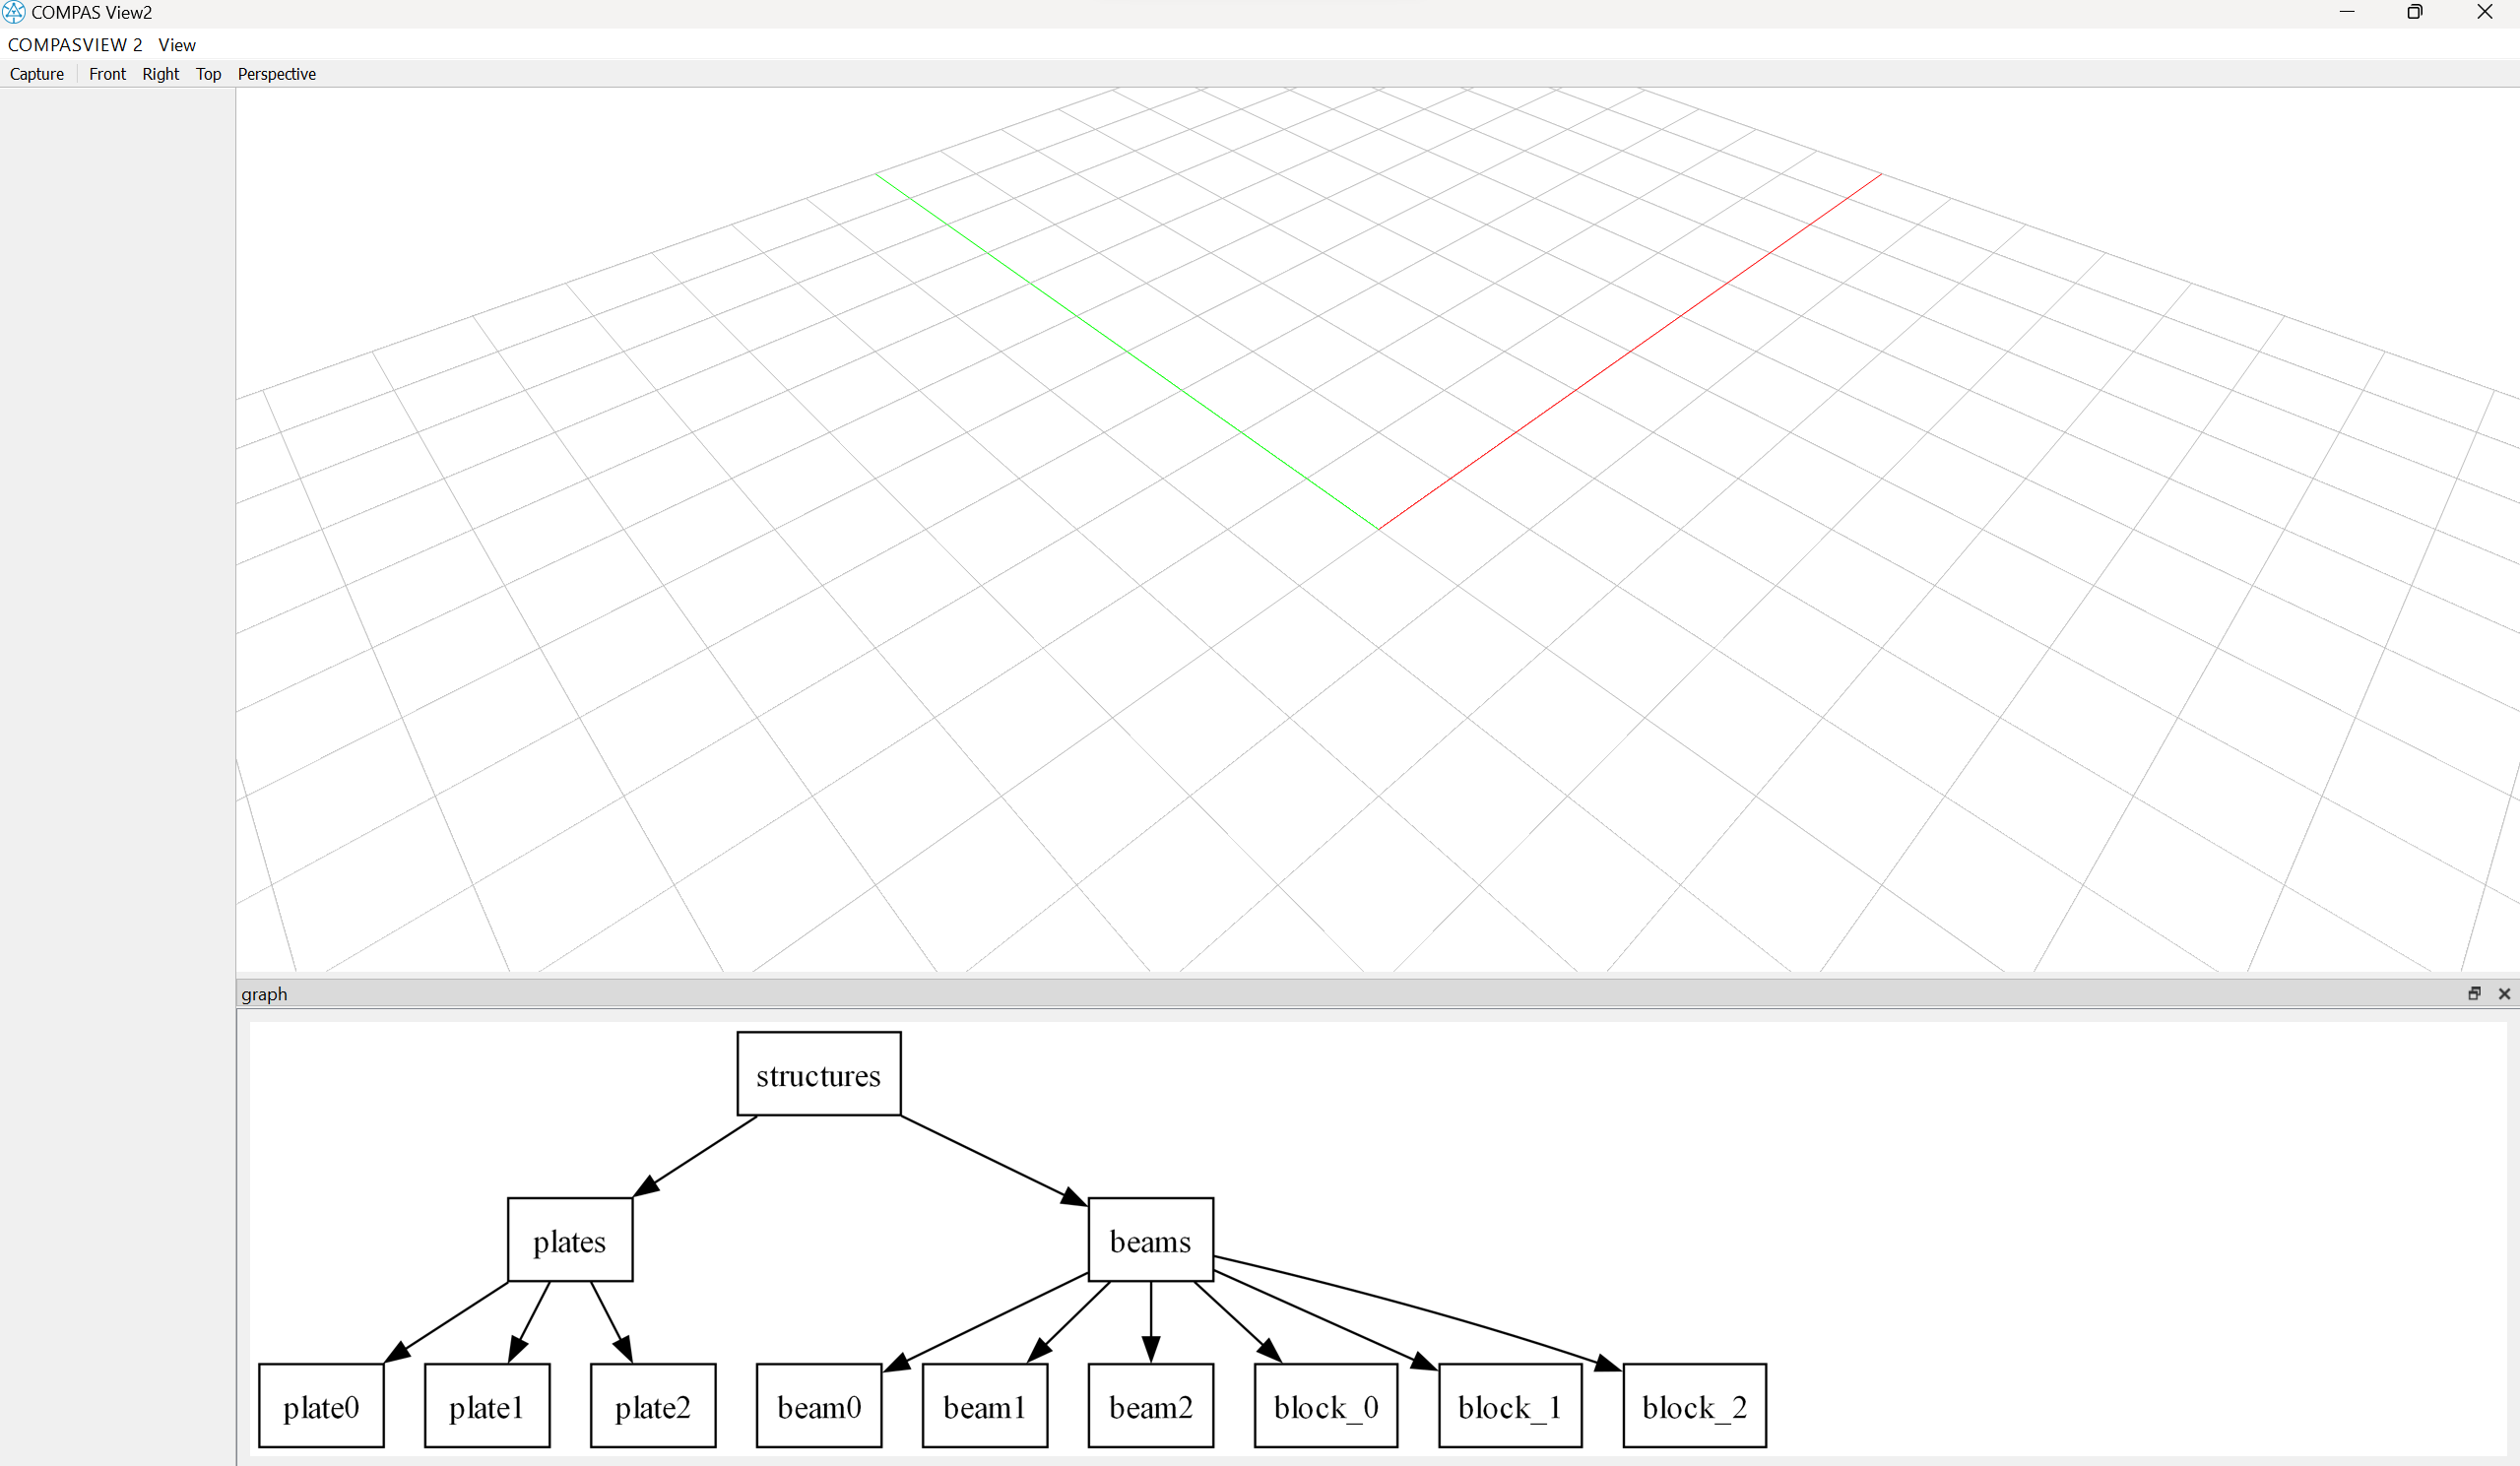
There are many ways to import your image for different purposes, local or remote, and in different formats. The following example shows how to integrate the viewer with Graphviz, a powerful library for presenting structural information, to help you visualize your data.
The following code requires Graphviz to be installed in https://graphviz.org/download/ .
from compas_view2.app import App
import os
from graphviz import Digraph
import matplotlib.image as mpimg
import matplotlib.pyplot as plt
from PIL import Image


# ==========================================================================
# crate a Graphviz
# ==========================================================================

# Set the path to the Graphviz executable
graphviz_executable = r"C:\Program Files\Graphviz\bin"
os.environ["PATH"] += (
    os.pathsep + graphviz_executable
)  # Add the Graphviz bin directory to the PATH environment variable

# Create a Digraph object
dot = Digraph(comment="graph", format="png")
# dot.attr(rankdir="LR")
dot.attr(splines="false")  # Avoid edge splines for a straighter layout
dot.attr(ranksep="0.2")  # Adjust the minimum distance between ranks

dot.node("structures", "structures", shape="rectangle")
dot.node("plates", "plates", shape="rectangle")
dot.node("beams", "beams", shape="rectangle")
dot.node("beam0", "beam0", shape="rectangle")
dot.node("beam1", "beam1", shape="rectangle")
dot.node("beam2", "beam2", shape="rectangle")
dot.node("plate0", "plate0", shape="rectangle")
dot.node("plate1", "plate1", shape="rectangle")
dot.node("plate2", "plate2", shape="rectangle")

for i in range(3):
    dot.node("block_" + str(i), "block_" + str(i), shape="rectangle")

# dot.edges(["AB", "AL"], shape="none", constraint="false")
dot.edge("structures", "plates", shape="none", constraint="True")
dot.edge("structures", "beams", shape="none", constraint="True")

for i in range(3):
    dot.edge("beams", "block_" + str(i), shape="none", constraint="True")


dot.edge("beams", "beam0", shape="none", constraint="True")
dot.edge("beams", "beam1", shape="none", constraint="True")
dot.edge("beams", "beam2", shape="none", constraint="True")
dot.edge("plates", "plate0", shape="none", constraint="True")
dot.edge("plates", "plate1", shape="none", constraint="True")
dot.edge("plates", "plate2", shape="none", constraint="True")


# Render the graph to a file
graph_output_image_filename = "graph_output_image"
dot.attr(dpi=str(300))
dot.render(graph_output_image_filename, format="png", engine="dot", cleanup=True, view=False)

# ==========================================================================
# Open the generated image and resize it
# ==========================================================================

with Image.open(f"{graph_output_image_filename}.png") as img:
    new_height = 440
    new_width = int(new_height * img.size[0] / img.size[1])
    img = img.resize((new_width, new_height))
    img.save(f"{graph_output_image_filename}.png", format="PNG")

# ==========================================================================
# intialize the compas_view2
# ==========================================================================
from qtpy.QtWidgets import QApplication, QDesktopWidget

app = QApplication([])  # Create a QApplication instance

# Get the primary screen's geometry
primary_screen = QDesktopWidget().screenGeometry(0)
screen_width = primary_screen.width()
screen_height = primary_screen.height()

print(screen_width, screen_height)
viewer = App(viewmode="shaded", enable_sidebar=True)  # Create a compas_view2 viewer
viewer.window.setGeometry(0, 0, screen_width, screen_height)
figure = viewer.plot(
    "graph", location="bottom", min_height=500
)  # Create an axis within the viewer to display the image

# ==========================================================================
# convert numpy.ndarray to matplotlib.figure.Figure
# ==========================================================================

image_data = mpimg.imread("graph_output_image.png")  # Load the image from "graph_output_image.png"
fig, ax = plt.subplots()  # Create a Matplotlib figure and axis
ax.imshow(image_data, cmap="gray", interpolation="nearest")  # Display the image on the axis
figure.clf()  # Clear the figure
figure.figimage(image_data, cmap="gray", interpolation="nearest")  # Display the image on the figure

# ==========================================================================
# run the compas_view2
# ==========================================================================

viewer.show()