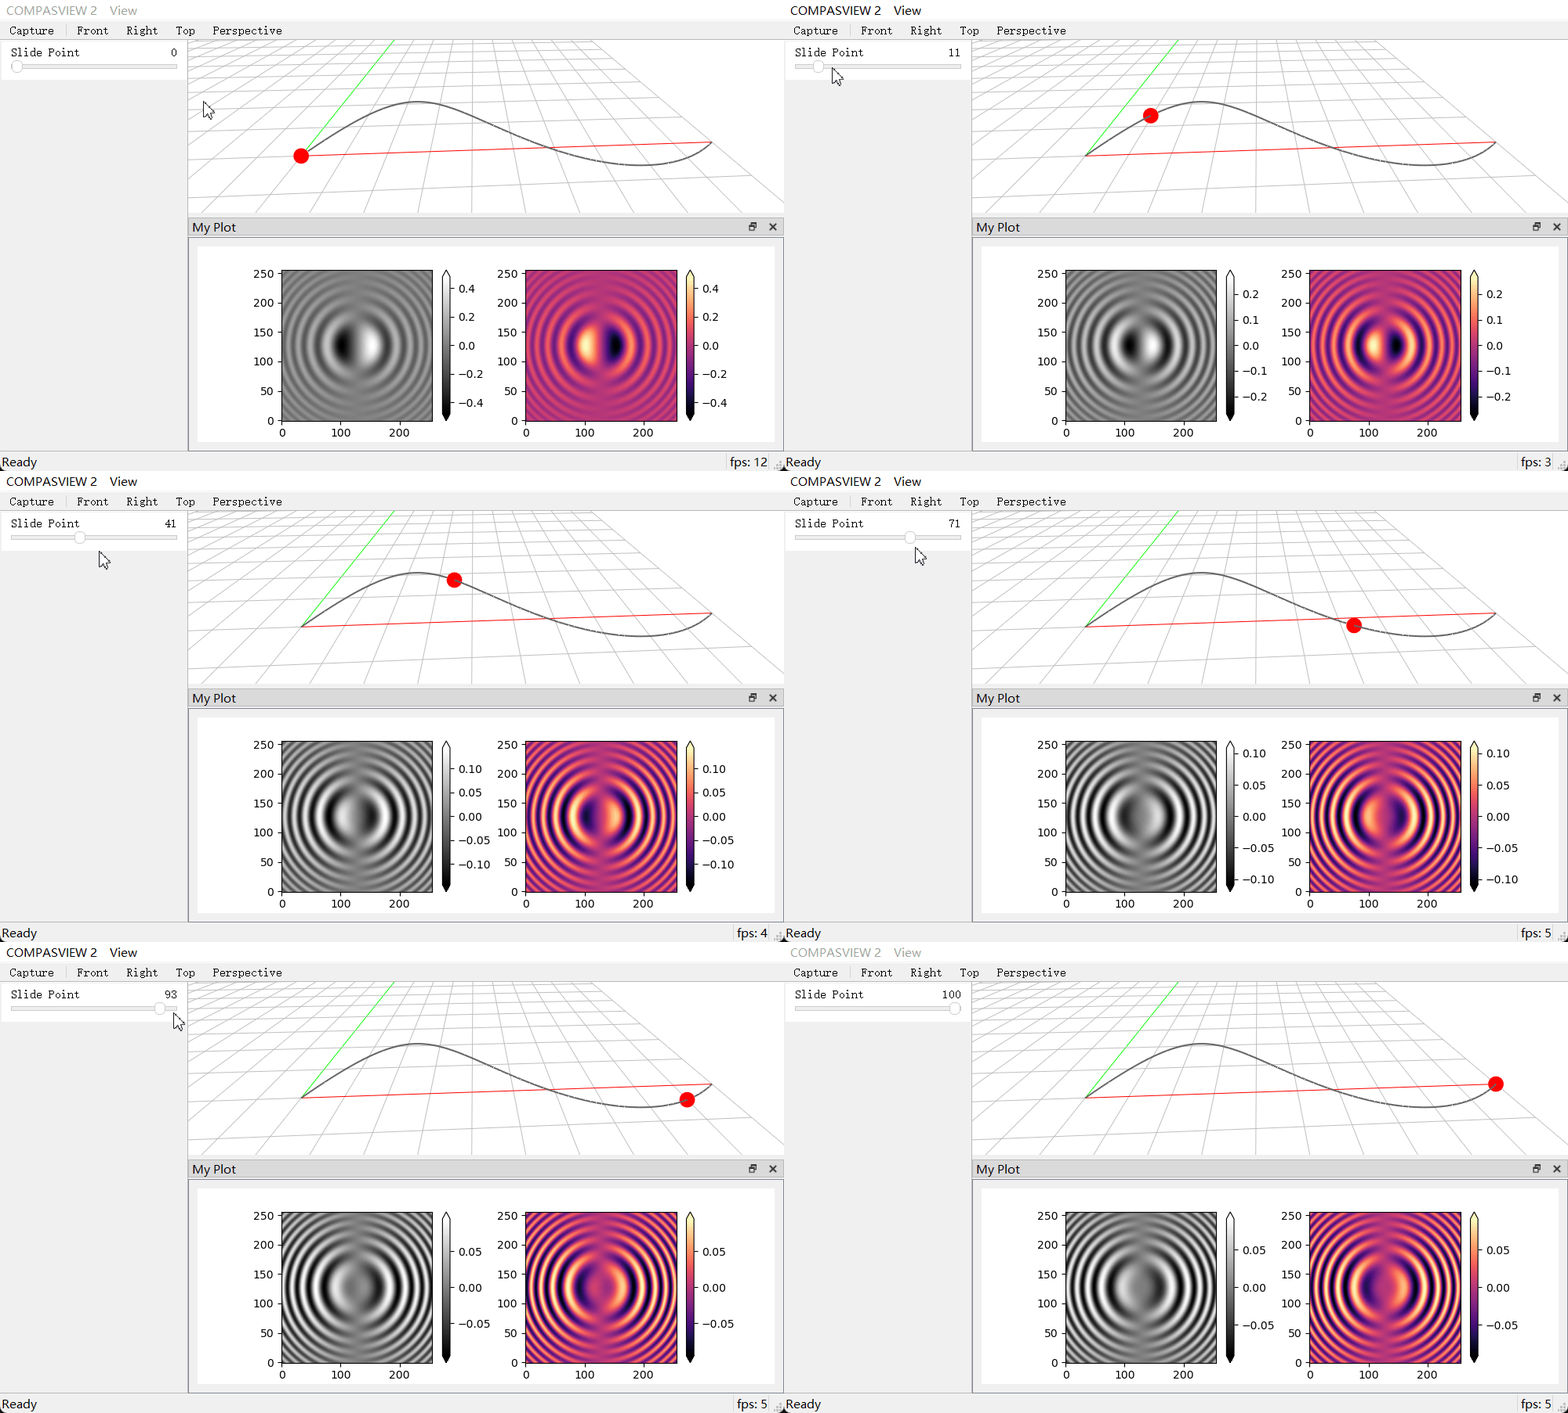
from compas.geometry import Point, Polyline, Bezier
from compas.colors import Color
from compas_view2.app import App

import numpy as np
import matplotlib.cm as cm

curve = Bezier([[0, 0, 0], [3, 6, 0], [5, -3, 0], [10, 0, 0]])

viewer = App(viewmode="shaded", enable_sidebar=True, width=1600, height=900)
pointobj = viewer.add(Point(* curve.point(0)), pointsize=20, pointcolor=(1, 0, 0))
curveobj = viewer.add(Polyline(curve.locus()), linewidth=2)

figure = viewer.plot("My Plot", location="bottom", min_height=300)


def update_plot(shift=0):
    n = 256
    x = np.linspace(-3., 3., n)
    y = np.linspace(-3., 3., n)
    X, Y = np.meshgrid(x, y)
    Z = X * np.sinc(X ** 2 + Y ** 2 + shift)
    if figure:
        figure.clf()
        figure.subplots(1, 2)

        a0 = figure.axes[0].imshow(Z, cmap=cm.gray, interpolation='bilinear', origin='lower')
        figure.colorbar(a0, ax=figure.axes[0], extend='both')

        a1 = figure.axes[1].imshow(-Z, cmap=cm.magma, interpolation='bilinear', origin='lower')
        figure.colorbar(a1, ax=figure.axes[1], extend='both')

        figure.update()


update_plot()


@viewer.slider(title="Slide Point", maxval=100, step=1, bgcolor=Color.white())
def slide(value):
    value = value / 100
    pointobj._data = curve.point(value)
    pointobj.update()
    viewer.view.update()
    update_plot(shift=value*3)


viewer.run()
