from pathlib import Path
from compas.colors import Color
from compas.geometry import Line
from compas.geometry import Point
from compas.geometry import Pointcloud
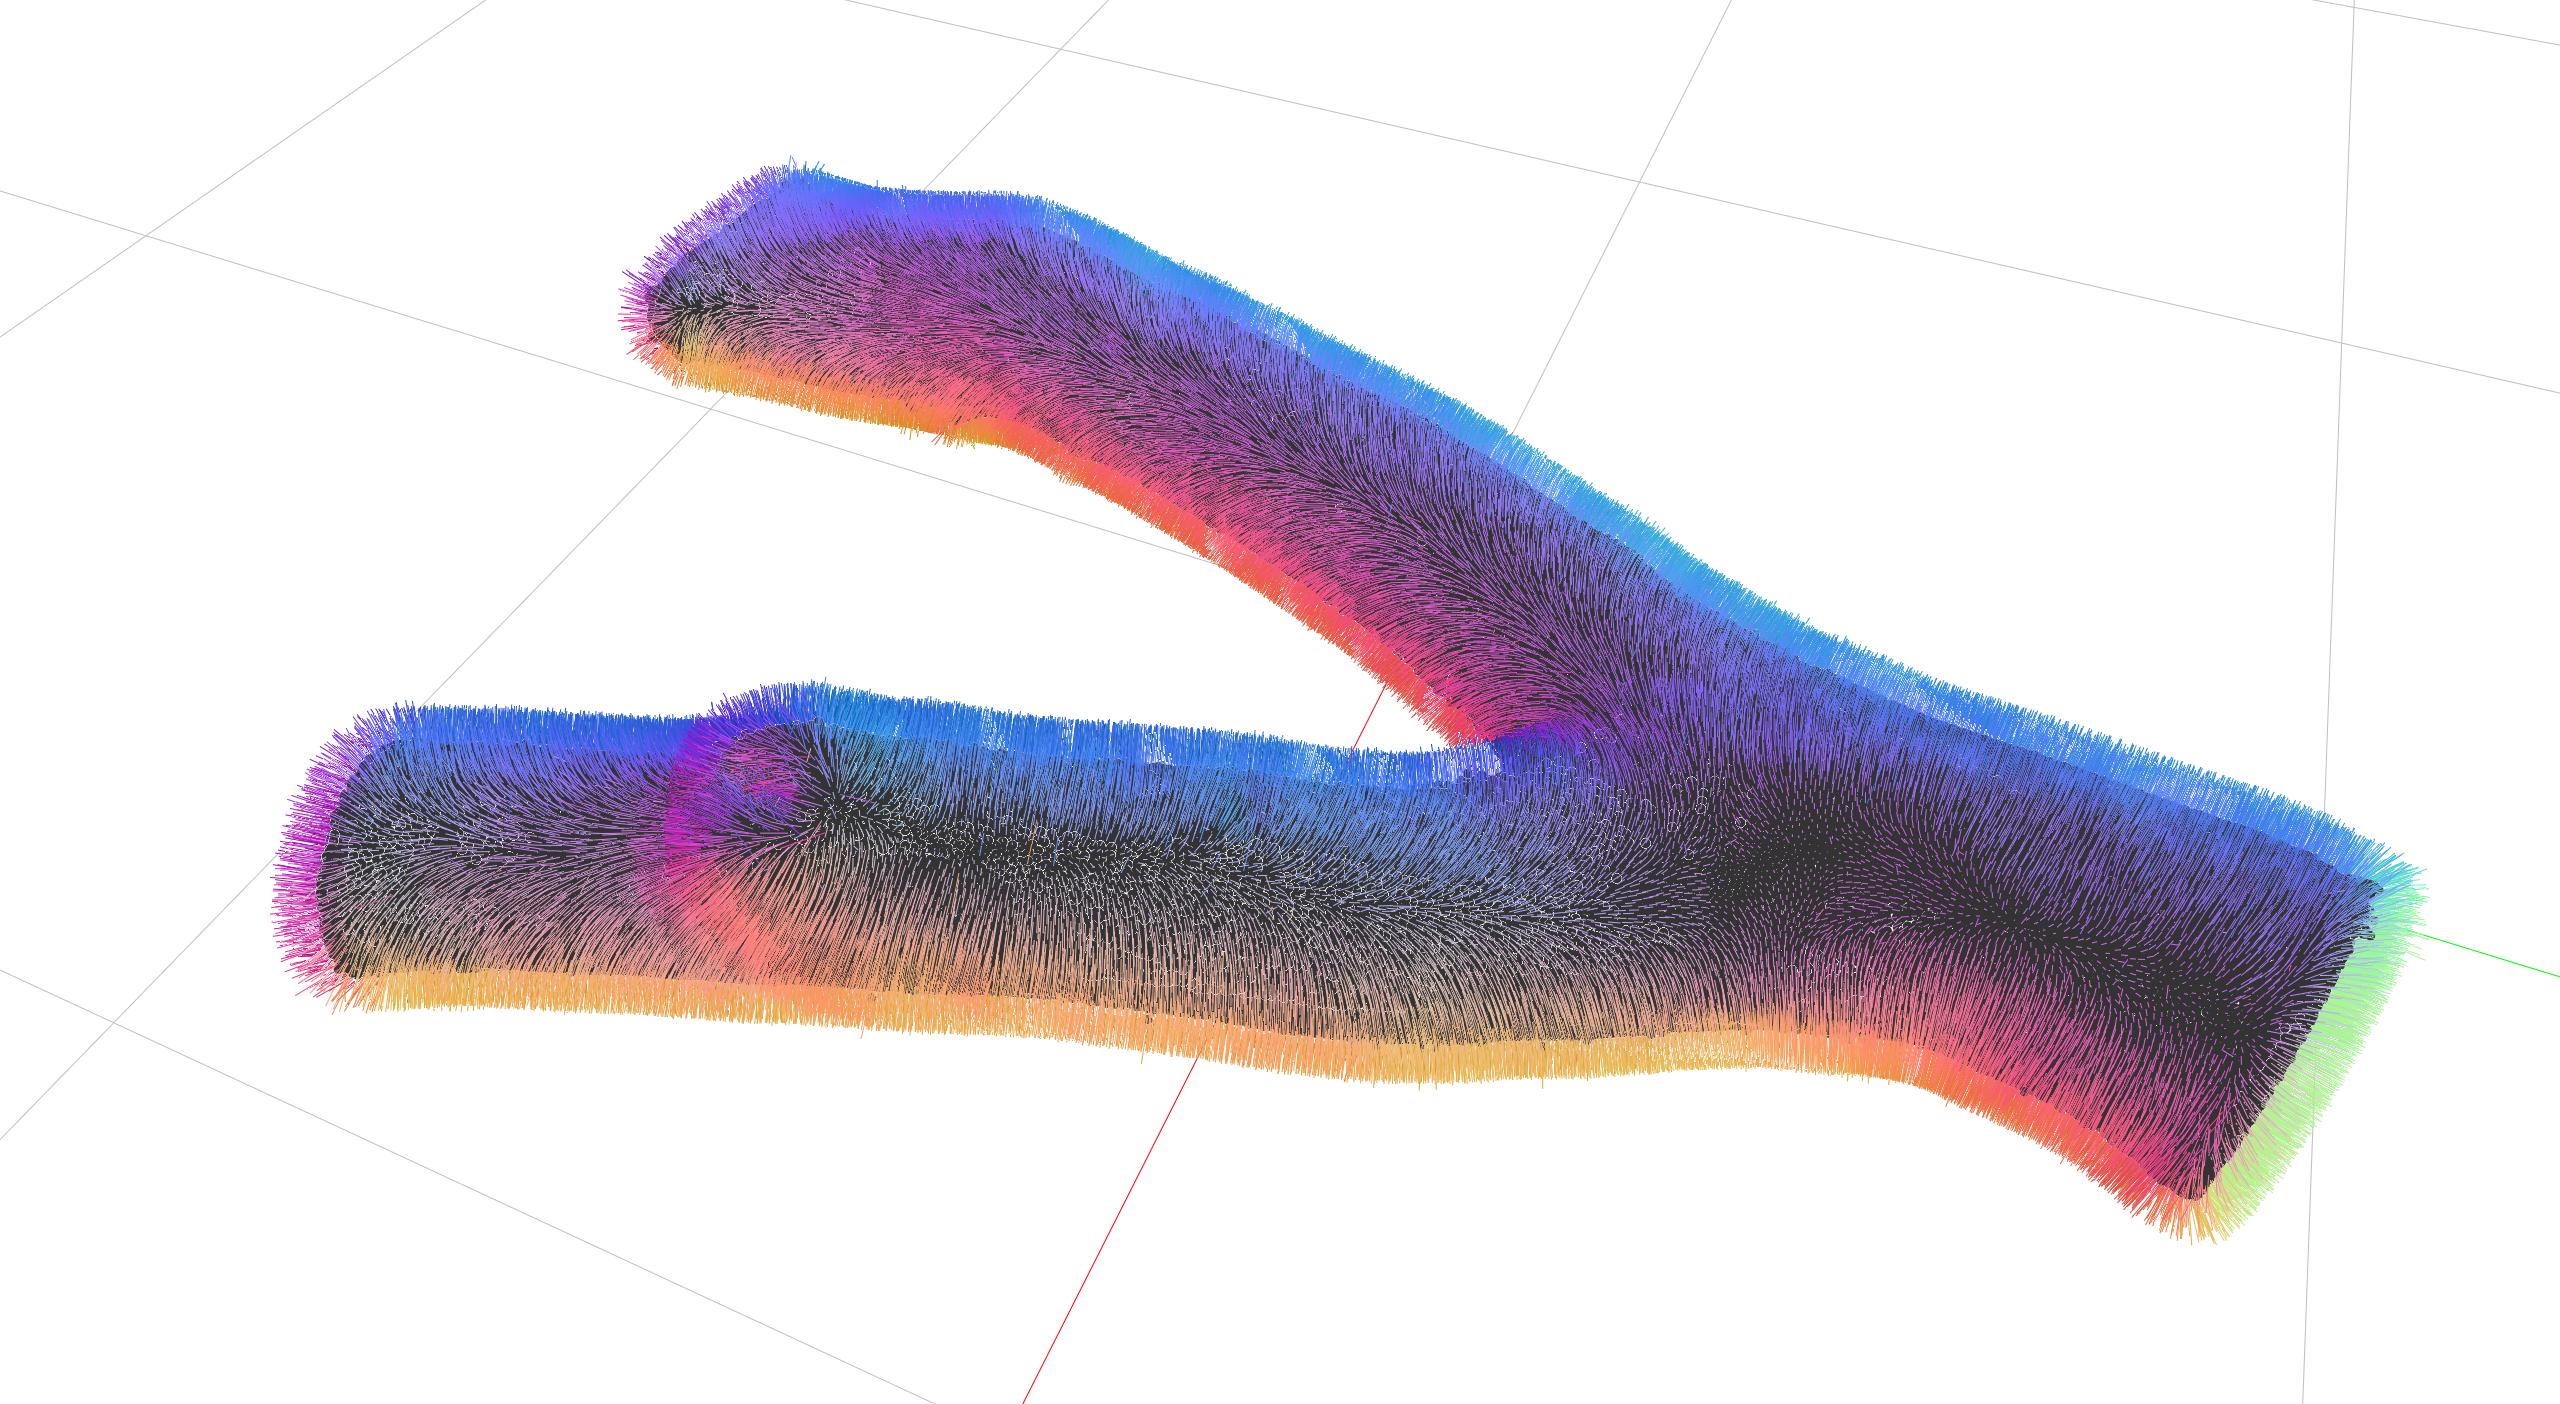
from compas_cgal.reconstruction import pointset_normal_estimation
from compas_viewer import Viewer
# from compas_view2.collections import Collection
# Define the file path for the point cloud data
FILE = Path(__file__).parent.parent.parent / "data" / "forked_branch_1.ply"
# Load the point cloud data from the PLY file
cloud = Pointcloud.from_ply(FILE)
# Estimate normals for the point cloud
points, vectors = pointset_normal_estimation(cloud, 16, True)
print(f"Original points: {len(cloud)}, Points with normals: {len(points)}, Vectors: {len(vectors)}")
# Create lines and properties for visualizing normals
lines = []
line_properties = []
line_scale = 25
# Iterate over points and vectors to create lines and color properties
for p, v in zip(points, vectors):
lines.append(
Line(
Point(p[0], p[1], p[2]),
Point(p[0] + v[0] * line_scale, p[1] + v[1] * line_scale, p[2] + v[2] * line_scale),
)
)
# Normalize vector components to be in the range [0, 1] for color representation
r = (v[0] + 1) * 0.5
g = (v[1] + 1) * 0.5
b = (v[2] + 1) * 0.5
# Store line color properties
line_properties.append({"linecolor": Color(r, g, b)})
# =============================================================================
# Viz
# =============================================================================
viewer = Viewer()
# viewer.renderer.camera.scale = 1000
# viewer.view.grid.cell_size = 1000
# line_collection = Collection(lines, line_properties)
# viewer.scene.add(Pointcloud(points))
# viewer.scene.add(line_collection)
# viewer.renderer.camera.zoom_extents()
viewer.show()